Technical analysis might seem tricky or even a little scary at first. But honestly, it’s just about looking at price charts and spotting patterns that can give you a clue about where the market might head next.
Each chart pattern has its own style, and once you get the hang of them, you’ll have a real edge as a trader. In this article, I’m going to keep it simple and look at two key patterns: the ascending triangle pattern and the descending triangle pattern.
By the end, you’ll understand how these patterns work, what they say about market mood, and most importantly, how you can trade them with confidence. So, let’s get started.
- An ascending triangle forms when price is squeezed between a flat resistance line at the top and a rising support line at the bottom, usually signaling a bullish breakout.
- A descending triangle forms when price is trapped between a flat support line at the bottom and a descending resistance line at the top, usually signaling a bearish breakdown
- Ascending triangles in an uptrend are typically continuation patterns, but in a downtrend they may indicate a reversal.
- Descending triangles in a downtrend are usually continuation patterns, but in an uptrend they may suggest a reversal.
- The psychology behind an ascending triangle is that buyers are gradually gaining strength while sellers hold resistance until it breaks.
- The psychology behind a descending triangle is that sellers are taking control as buyers fail to defend support.
- A valid triangle requires at least two touches on both the support and resistance lines.
Triangles Chart Patterns Explained
A triangle pattern forms on a chart when prices move within two trendlines: one flat and the other moving up or down. This gives it that clear triangle look.
There are three main kinds of triangle patterns: symmetrical, ascending, and descending. In our last article, I talked about the symmetrical triangle pattern. Now, I’ll shift the spotlight to the ascending and descending triangle patterns. These two are especially useful for spotting trading opportunities, so let’s break them down step by step.
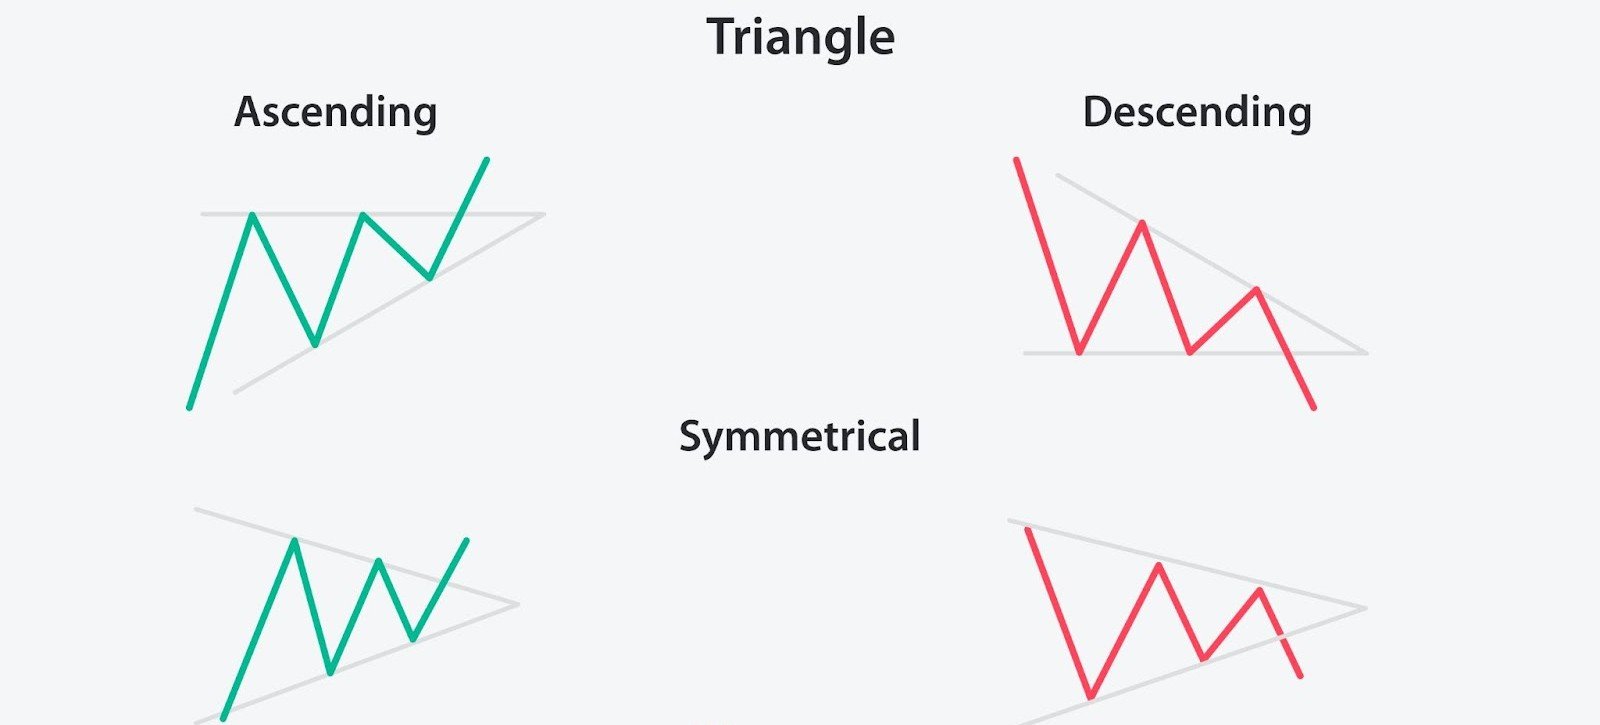
Ascending Triangle Pattern
An ascending triangle pattern in an uptrend is seen as a continuation pattern. It forms when the price gets squeezed between a flat resistance line at the top and a rising support line at the bottom. In simple terms, buyers keep stepping in at higher and higher levels, while sellers hold their ground at the same resistance, until the price finally breaks through, most often to the upside.
As shown in the picture, this pattern has three main parts:
- Flat resistance line (top): Drawn across the highs where the price struggles to break through.
- Rising support line (bottom): Slopes upward as each dip forms a higher low.
- Overall look: A right-angled triangle pointing upward.
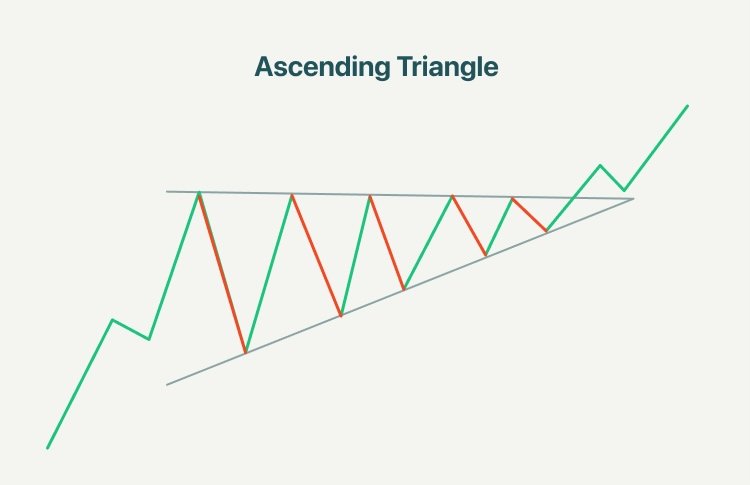
Although in most cases, this pattern appears in an uptrend and often acts as a continuation signal, there is also an ascending triangle pattern in a downtrend, signaling a reversal shift, as buyers (the bulls) are starting to take charge.
Descending Triangle Pattern
A descending triangle pattern in a downtrend is usually seen as a bearish signal. It forms when the price gets trapped between a flat support line at the bottom and a descending resistance line at the top. In simple terms, sellers keep stepping in at lower and lower levels, while buyers try to hold the same support level, until it finally breaks, most often to the downside.
As shown in the picture, this pattern has three main parts:
- Flat support line (bottom): Drawn across the lows where price finds buying pressure, but eventually gives way.
- Descending resistance line (top): Sloping downward as each rally forms a lower high.
- Overall look: A right-angled triangle pointing downward.
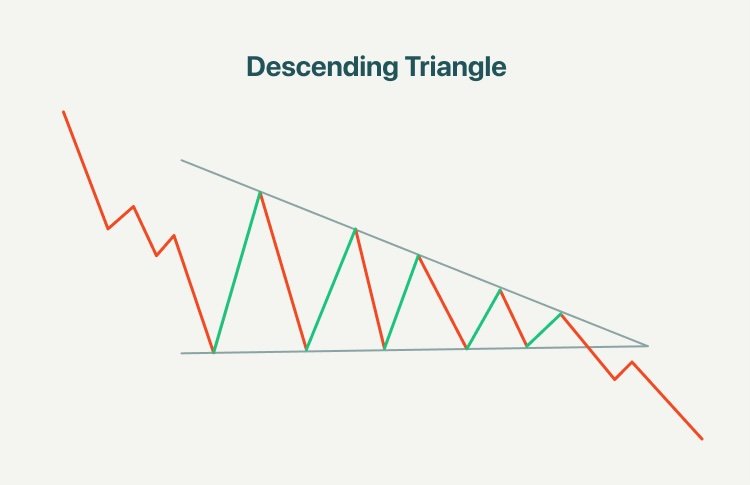
Most of the time, this pattern shows up in a downtrend as a continuation signal. However, a descending triangle pattern in an uptrend can act as a reversal signal, warning that sellers (the bears) are starting to take control.
Market Psychology Behind Ascending and Descending Triangles
An ascending triangle pattern shows that buyers are gradually gaining strength. Each time the price pulls back, buyers are willing to pay slightly more than before, which pushes the lows higher. At the same time, sellers keep holding the price at the same resistance level. Over time, the pressure from buyers builds up, and once the resistance breaks, many sellers step aside while new buyers enter. This often leads to a breakout above the resistance line.
A descending triangle pattern shows the opposite. Sellers gradually take control as each bounce gets weaker. They push the price down from lower and lower levels, creating a series of lower highs. Buyers still try to save the support zones, but their strength isn’t enough. Once the support finally breaks, many buyers exit, while sellers add more pressure, often causing a solid drop.
So, the key idea is:
- An ascending triangle pattern reflects stronger buying power.
- A descending triangle pattern reflects stronger selling power.
Trading Ascending and Descending Triangle Patterns
Here is a step-by-step guide to trading the ascending and descending triangles chart patterns:
Step 1: Spot the Overall Trend
Well, ascending or descending triangles usually act as continuation patterns, meaning they often move in the same direction as the current trend. So to find them, first of all, you need to recognize the overall trend.
- If the market’s going up, an ascending triangle pattern is more reliable.
- If the market’s going down, a descending triangle pattern is more reliable.
Step 2: Identify the Triangle Formation
Once you know the overall trend, it’s time to look for triangle patterns.
Ascending Triangle consists of:
- Flat (horizontal) resistance line at the top.
- Rising support line (higher lows).
Descending Triangle consists of:
- Flat (horizontal) support line at the bottom.
- Falling resistance line (lower highs).
Step 3: Check for Multiple Touches
For a triangle pattern to be valid, you should see at least 2 touches on each side. The more touches, the stronger the pattern.
- Ascending: 2 touches on resistance and 2 on the rising trendline.
- Descending: 2 touches on support and 2 on the falling trendline.
Step 4: Identify the Pattern’s Breakout
After finding the pattern, wait for the breakout.
- Ascending triangles usually break above resistance (bullish).
- Descending triangles usually break below support (bearish).
Step 5: Wait for Confirmations
Don’t rush! After a breakout, it’s smart to wait for confirmation. This could be candlestick signals like engulfing patterns, tweezer top and bottom, or using technical indicators.
Also, keep an eye on volume. Volume often decreases while the triangle pattern is forming (market is “squeezing”). But when the breakout happens, a spike in volume is a solid confirmation.
Step 6: Enter the Trade
finally:
- Go long after an ascending triangle breakout (with confirmation).
- Go short after a descending triangle breakout (with confirmation).
Step 7: Set Stop-Loss and Take-Profit Target
Fake breakouts can happen, so always protect yourself.
- For an ascending triangle breakout (bullish): place your stop-loss just below the last swing low or the rising trendline.
- For a descending triangle breakdown (bearish), place your stop-loss just above the last swing high or the falling trendline.
When setting a Take-Profit order, traders usually place it just above the last swing highs or just below the last swing lows. Another way to set a target is by using the triangle pattern: for an upward breakout, add the triangle’s height (resistance minus the lowest swing low) to the breakout price; for a downward breakout, subtract the triangle’s height (highest swing high minus support) from the breakdown price. Example in USDT:
- Ascending triangle pattern target: Resistance 100 USDT, lowest low 90 USDT. So the target will be: 100 + 10 = 110 USDT
- Descending: Support 50 USDT, highest high 60 USDT. So the target will be: 50 – 10 = 40 USDT
Ascending Triangle Pattern in an Uptrend: Real Scenario
So far, I’ve talked about ascending and descending triangle patterns and how to trade them effectively. Now, let’s put that knowledge into practice and look at some real examples.
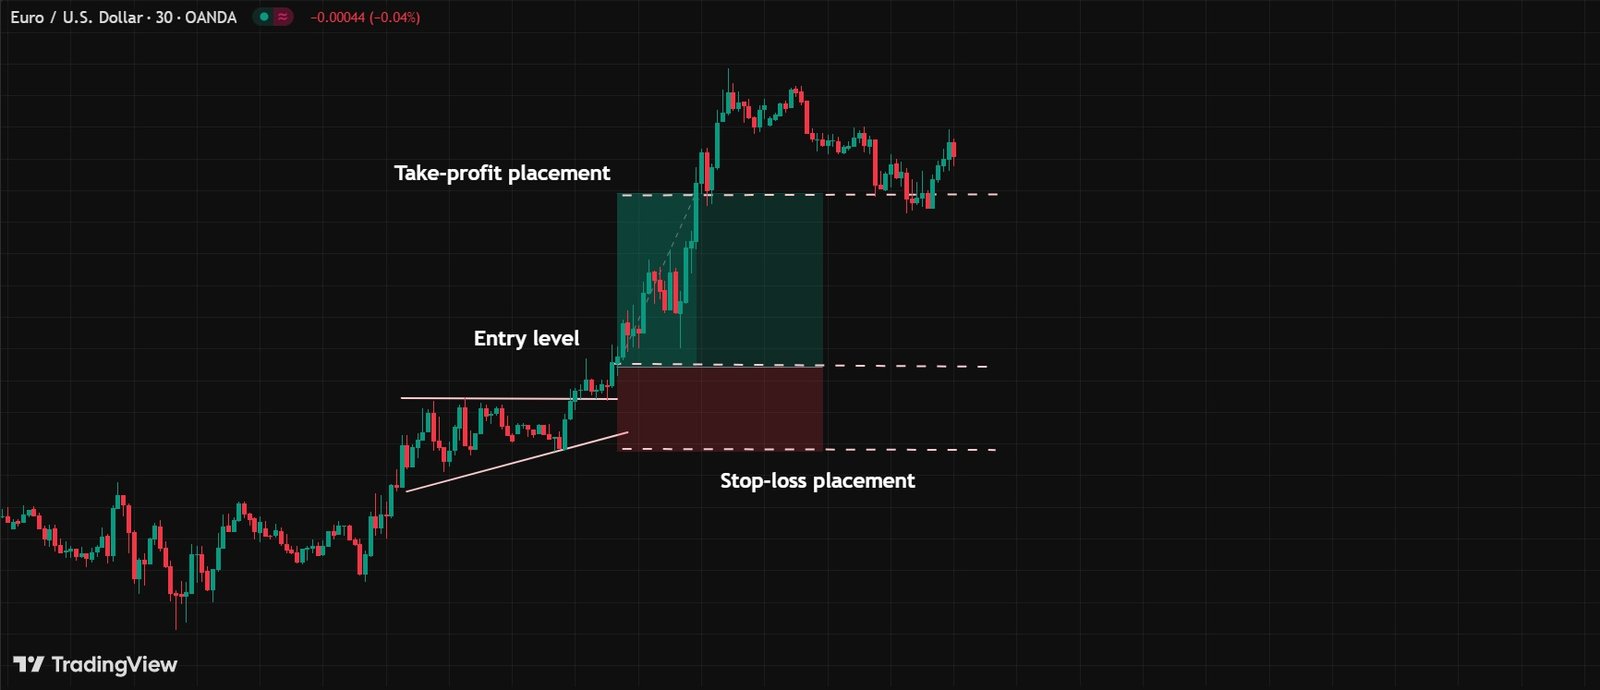
In the chart below, you can see that the overall trend was bullish, and an ascending triangle pattern formed during the uptrend. As I mentioned earlier, this pattern is made up of a rising support line and a flat resistance line. This shows that buyers are getting stronger, pushing the price higher each time.
Towards the end of the pattern, the price got tighter and eventually broke out above the resistance. After the breakout, the uptrend continued as expected.
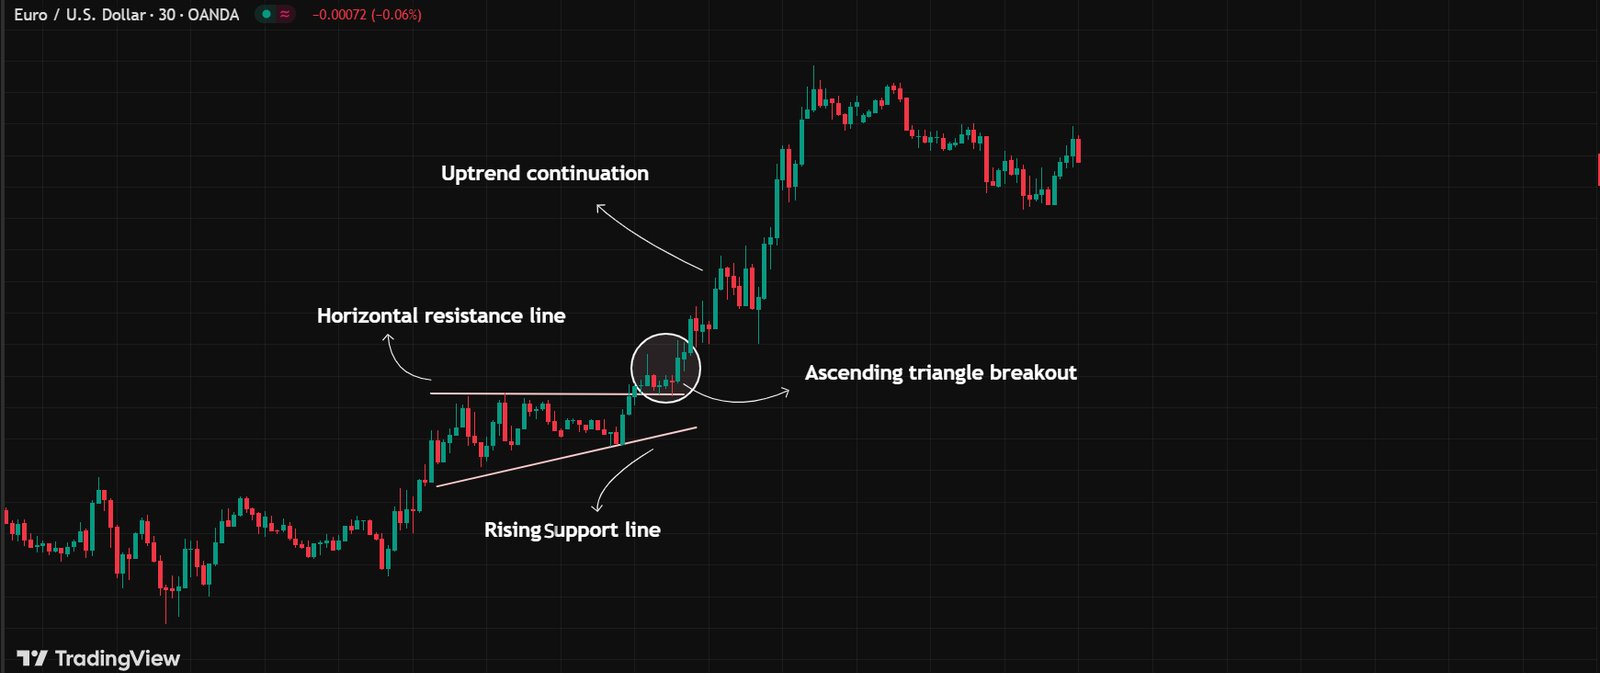
Here’s how you could trade this setup:
- Enter the trade once the breakout happens and a bullish candle closes above the resistance line.
- Place your take-profit target near the recent swing highs.
- Put your stop-loss just below the support line.
Descending Triangle Pattern in a Downtrend: Real Scenario
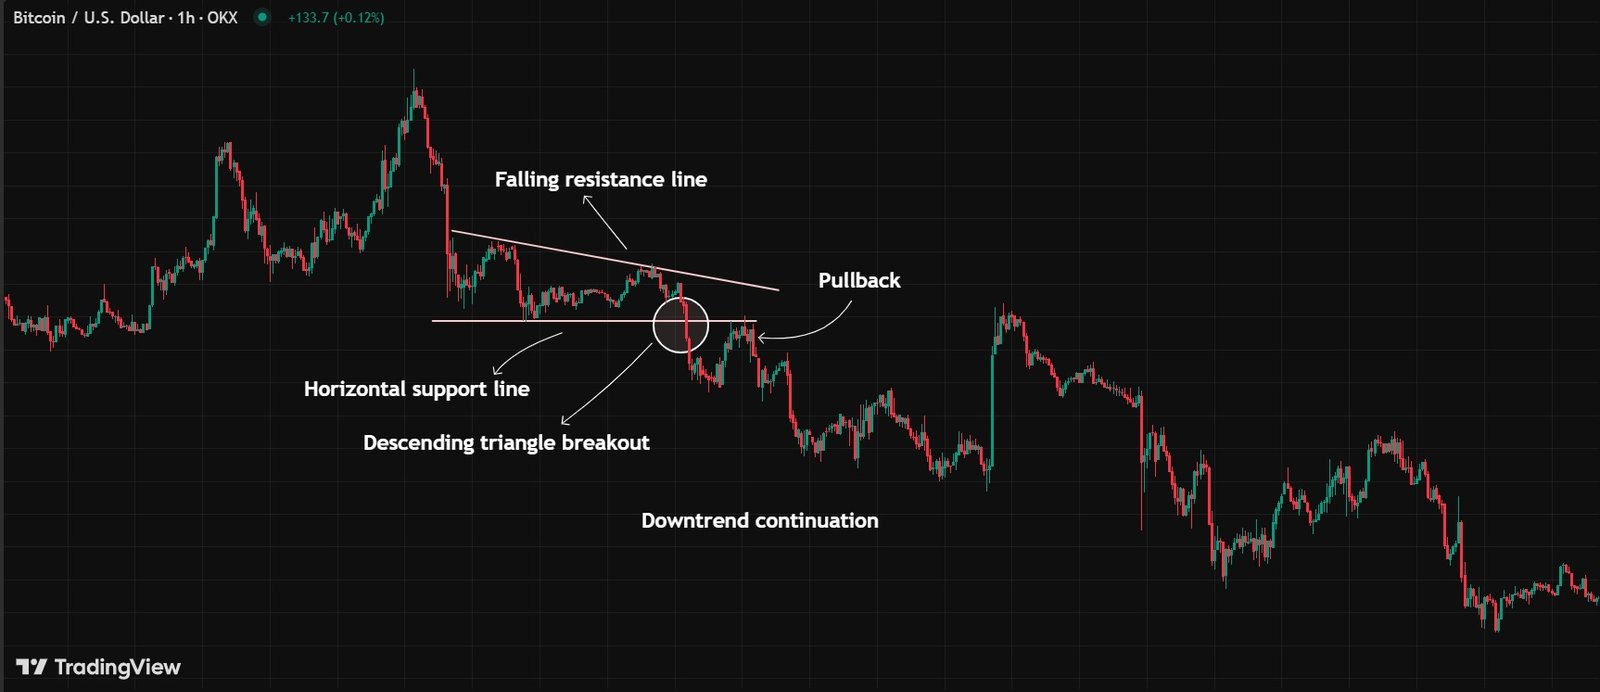
In the example below, you can see that during the downtrend, the price formed a descending triangle pattern. As the price narrowed and the pattern fully took shape, it eventually broke below the support level. After that, there was a pullback, which acted as strong confirmation of the pattern.
Here’s how you could trade this setup:
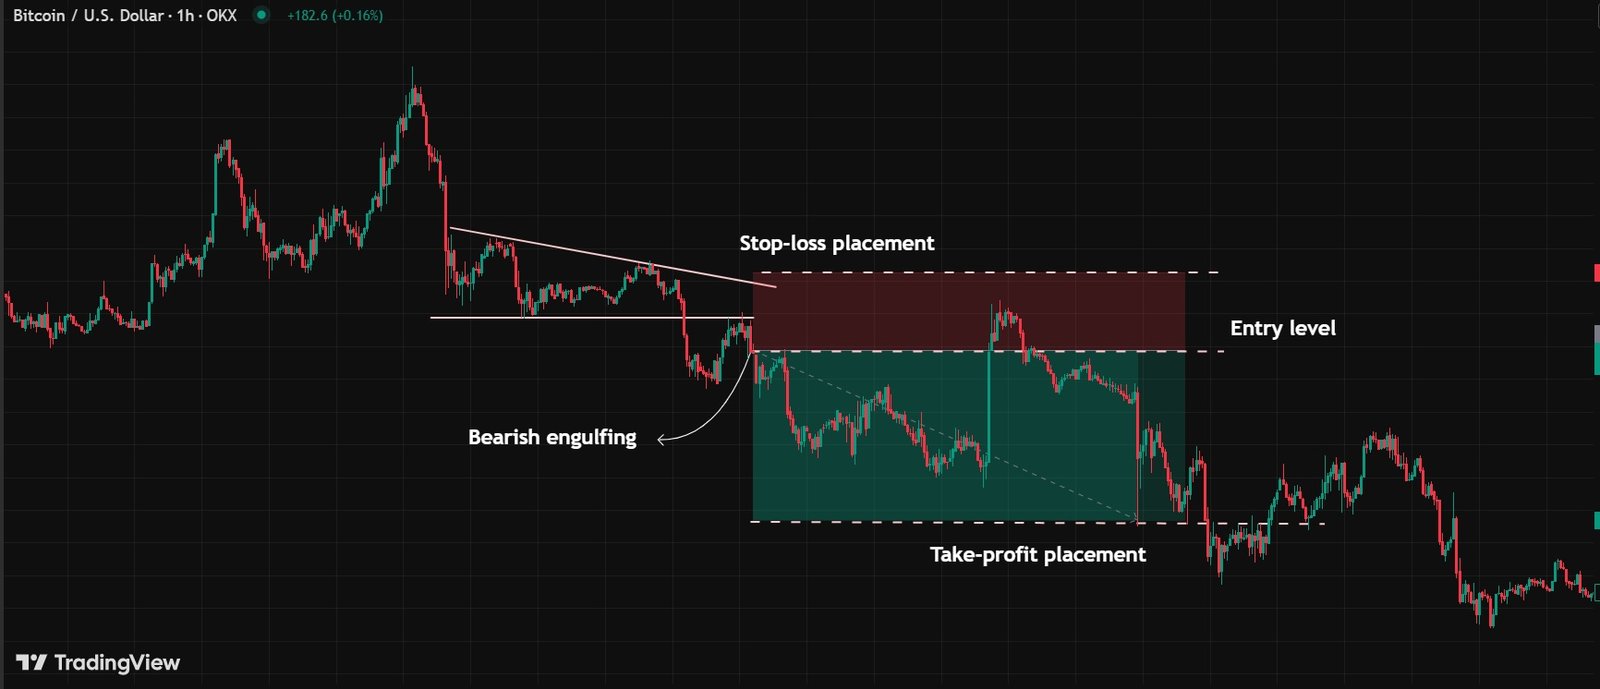
- Enter the trade once the breakout happens and a bearish engulfing candle closes after the price drops below support.
- Place your take-profit target near the recent swing lows.
- Set your stop-loss just above the resistance line.
Conclusion
By now, you should have a solid understanding of how ascending and descending triangle patterns work on price charts. Typically, an ascending triangle pattern forms during an uptrend, indicating that the trend is likely to continue. On the flip side, a descending triangle pattern often appears in a downtrend, suggesting that the price will keep moving lower.
In some cases, though, you might spot an ascending triangle in a downtrend or a descending triangle in an uptrend. These situations hint at a possible trend reversal—but honestly, they’re not very common.
FAQ
Is the triangle pattern bullish or bearish?
A triangle pattern can be both bullish or bearish, depending on the type: ascending is bullish, descending is bearish, and symmetrical can go either way.
What is a descending triangle?
An ascending triangle is a price chart pattern that looks like a triangle with a flat resistance line and a rising support line.
Is an ascending triangle bullish?
An ascending triangle pattern in an uptrend is bullish, though it rarely appears in a downtrend, where it may signal a reversal.
How to use the ascending triangle pattern?
To use an ascending triangle pattern, first spot the trend, then identify its shape, watch for the breakout, and finally determine your entry levels.
What is a descending triangle pattern?
A descending triangle is often a continuation pattern, usually appearing in a downtrend and signaling that the downtrend will likely continue.
Can a descending triangle be bullish?
No. A descending triangle is a bearish pattern in both an uptrend and a downtrend.


