Ever wondered how some traders just know when the market’s about to flip? Catching trends might look easy from the outside, but the real trick is spotting the exact moment things turn around. That’s where reversal patterns come in. Tools like the Double Top and Double Bottom patterns make it a lot less of a guessing game and a lot more of a clear signal.
In this article, I’ll walk you through these patterns step by step, using real chart examples (like BTC) so you can spot them yourself and trade with confidence.
- A Double Top signals bearish reversal and typically shows up when an uptrend is running out of steam.
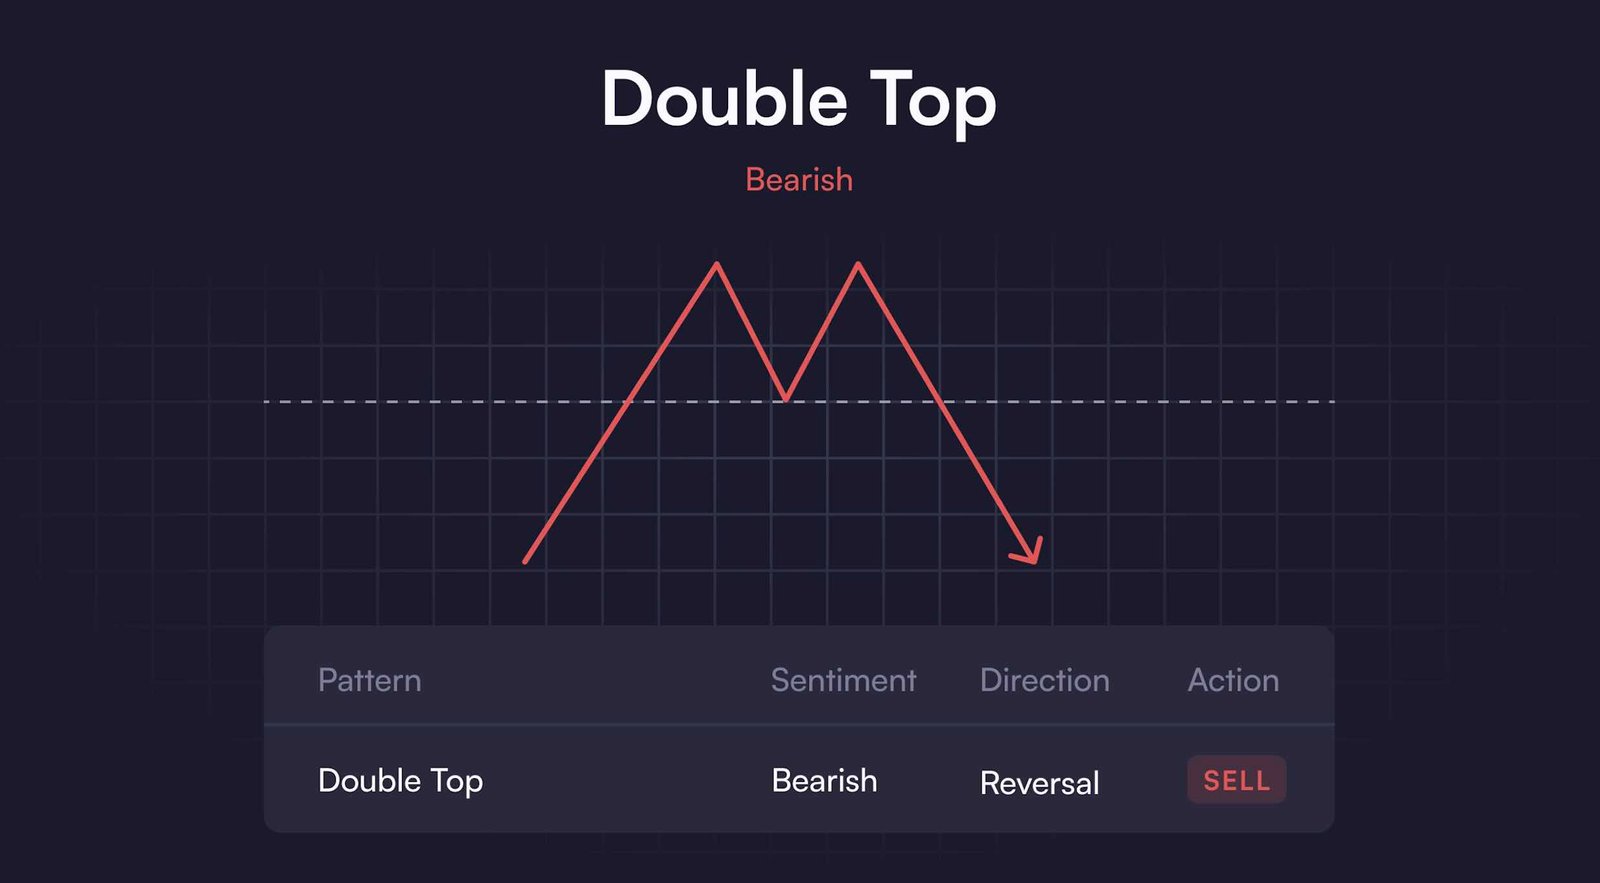
- On the chart, the double top setup looks like an “M,” with two peaks failing to push higher.
- A Double Bottom is the opposite, marking bullish reversal at the end of a downtrend.
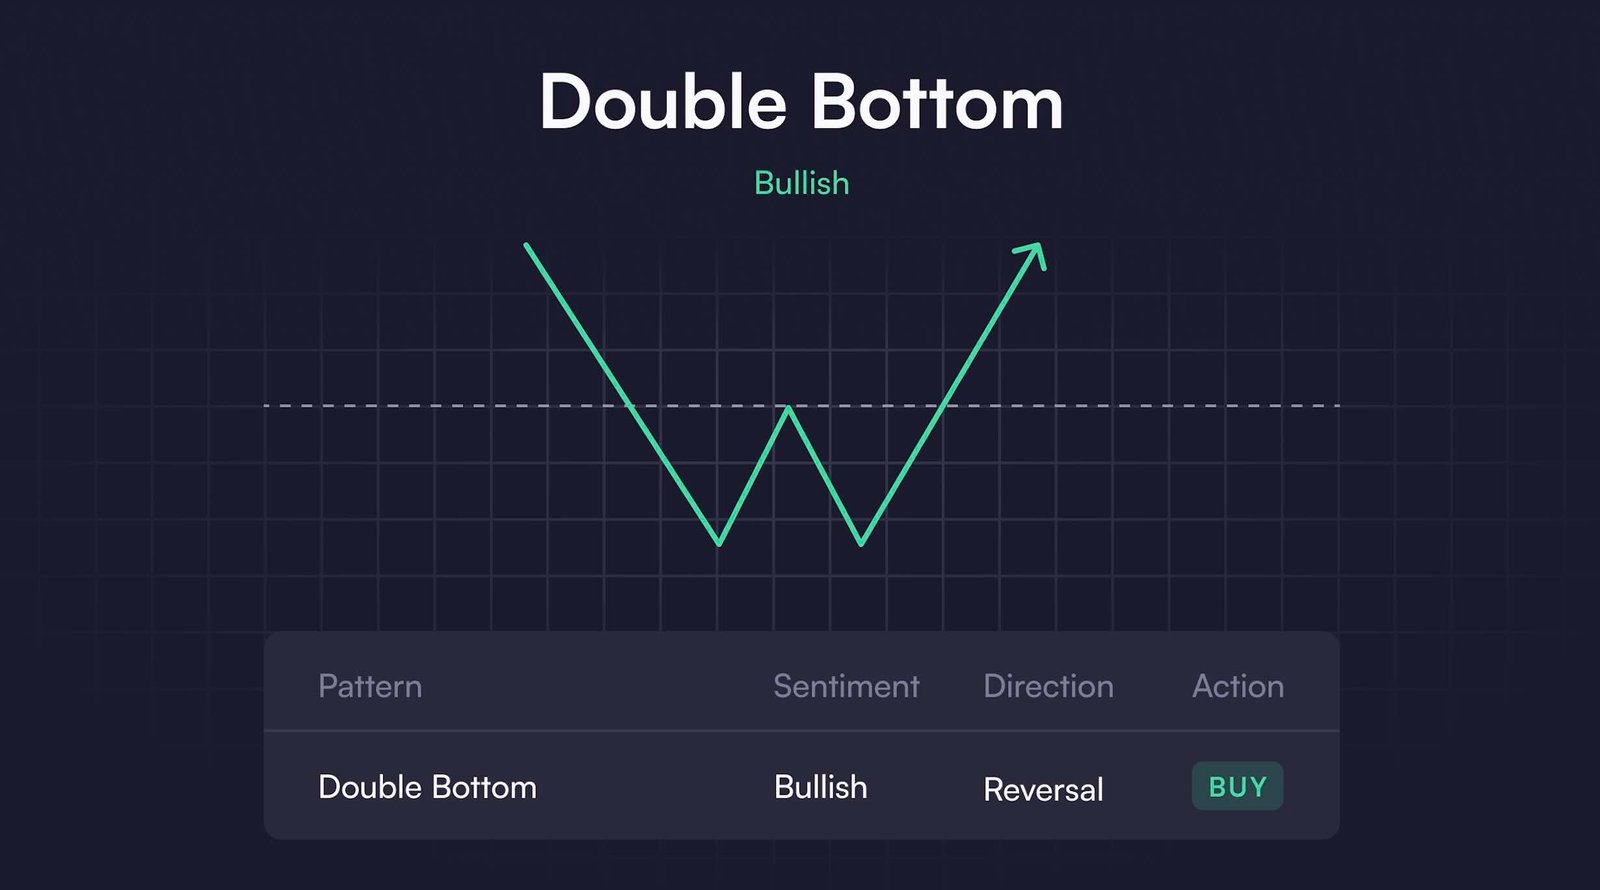
- This one looks like a “W,” showing the market failing to break lower twice.
- The neckline break is what confirms both patterns—it’s the line that makes or breaks the setup.
What Is a Double Top Pattern?
A double top pattern is what traders call a bearish reversal signal, and it usually shows up at the end of an uptrend. Just like the name hints, this pattern is made up of two peaks, or highs, that usually sit at about the same level. Between those two peaks, there’s a small dip, so when you look at it on a price chart, it ends up looking a lot like the letter “M.” Think of it as the market trying to push higher twice, but failing both times.
What Is a Double Bottom Pattern?
Now, a double bottom pattern is pretty much the opposite. Instead of showing up after prices climb, it usually forms at the end of a downtrend. In this case, the chart shows two low points at roughly the same level, with a small bump in between. If you trace it out, it looks like the letter “W.” You can imagine it as the market trying to drop lower twice but not being able to break past that level.
4 Steps to Identify the Double Top and Bottom Patterns
When it comes to trading chart patterns, just knowing what a double top trading pattern or double bottom looks like isn’t enough. You’ve got to spot them correctly on the chart first. Here’s a simple step-by-step way to do that:
1- Identify the Trend
First things first: check the current trend. A double top usually shows up at the end of an uptrend, while a double bottom trading pattern forms at the end of a downtrend. An uptrend means prices keep making higher highs and higher lows. A downtrend is the opposite, with lower lows and lower highs. So before anything else, figure out what kind of move the market is in.
2- Identify the First Peak and the First Low
In an uptrend, prices push higher again and again. But at some point, sellers step in and slow things down. The price reaches a high point, then pulls back a bit: that’s your first peak in a double top pattern.
For a double bottom pattern, flip the story: the price is falling, but eventually it hits strong support where buyers jump in. The price bounces back up for a while, and that first bounce marks the first low in the pattern
3- Identify the Second Peak and the Second Low
Now, here’s where things get interesting. In a double top pattern, after the first pullback, the price tries to climb again. But instead of breaking past the previous high, it stalls and forms another peak at about the same level as the first one. That’s your second top: showing sellers are still in control.
For a double bottom, it works the same way but in reverse. After the first bounce, the price drops again. This time, though, it fails to break lower and bottoms out at about the same level as the first low. Boom: there’s your second bottom.
4- Draw the Neckline
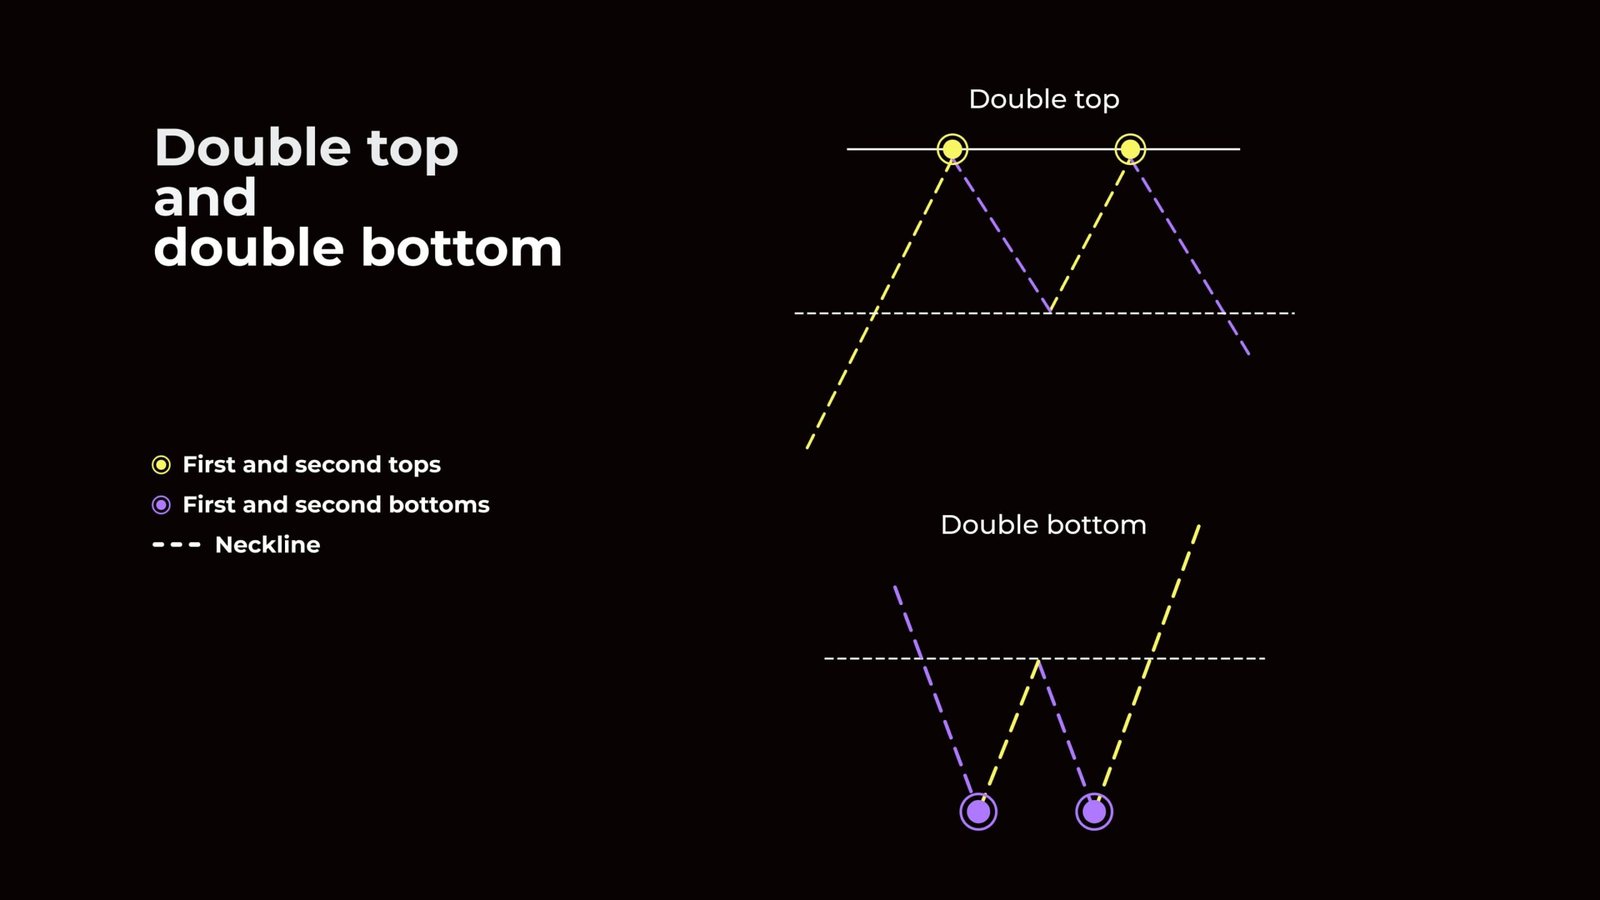
Both patterns are only confirmed once the price breaks through what’s called the neckline. Think of the neckline as the “divider line” that shows whether the pattern is legit.
- In a double top, the neckline is a horizontal line drawn across the low point between the two peaks.
- In a double bottom, the neckline is drawn across the high point between the two lows.
If you remember, this happens in the Head and Shoulders Patterns, Cup and Handle Pattern, and some others too; the neckline break is what confirms the move. That’s why drawing this line is such a key step in spotting reliable setups.
Trading Double Top and Double Bottom Pattern
So, you’ve learned how to spot double top and double bottom patterns. The next step is putting them into action. To trade these patterns successfully, here are the key steps you should follow:
1- Find essential support and resistance levels
The very first step is to mark out important support and resistance zones on your chart. These are the areas where price might reverse, and they’re also where double tops or double bottoms are most likely to form. Think of them as the “battle zones” between buyers and sellers.
2- Identify the double top/bottom patterns
Once your levels are marked, the next step is to confirm the pattern itself. If you remember, I already went through how to identify these formations earlier. This is just about applying that knowledge here!
3- Identifying the Double Top/Bottom Pattern Entry
After confirming the setup, you can look for an entry point:
- Double Top (Bearish Reversal): Wait for the price to break below the neckline and retest it. That’s your signal to enter short.
- Double Bottom (Bullish Reversal): Wait for the price to break above the neckline and retest it as support. That’s your cue to go long.
That pullback after the break is the key; it helps filter out failed double bottom patterns or fake double top patterns and keeps you from jumping in too early.
4- Stop-loss Order Placement
Getting in is one thing, but protecting your account is just as important. A stop-loss makes sure a bad trade doesn’t turn into a disaster.
- For a double top trade, put your stop-loss above the second peak, the neckline, or the nearest resistance.
- For a double bottom trade, put your stop-loss below the second low, the neckline, or the nearest support.
This way, even if the market goes against you, you’re not left hanging.
5- Take-profit Order Placement
Finally, plan where to take profits before you even enter the trade.
- In a double top, which signals a bearish reversal, target support areas or previous swing lows.
- In a double bottom, which signals a bullish reversal, target resistance areas or earlier swing highs.
Putting It All Together: A Real Double Top Pattern Example
I’ve now covered everything you need to know about double top and double bottom patterns: how to spot them on the chart and how to trade them. To make things clearer, let’s bring all that theory into practice with a real example.
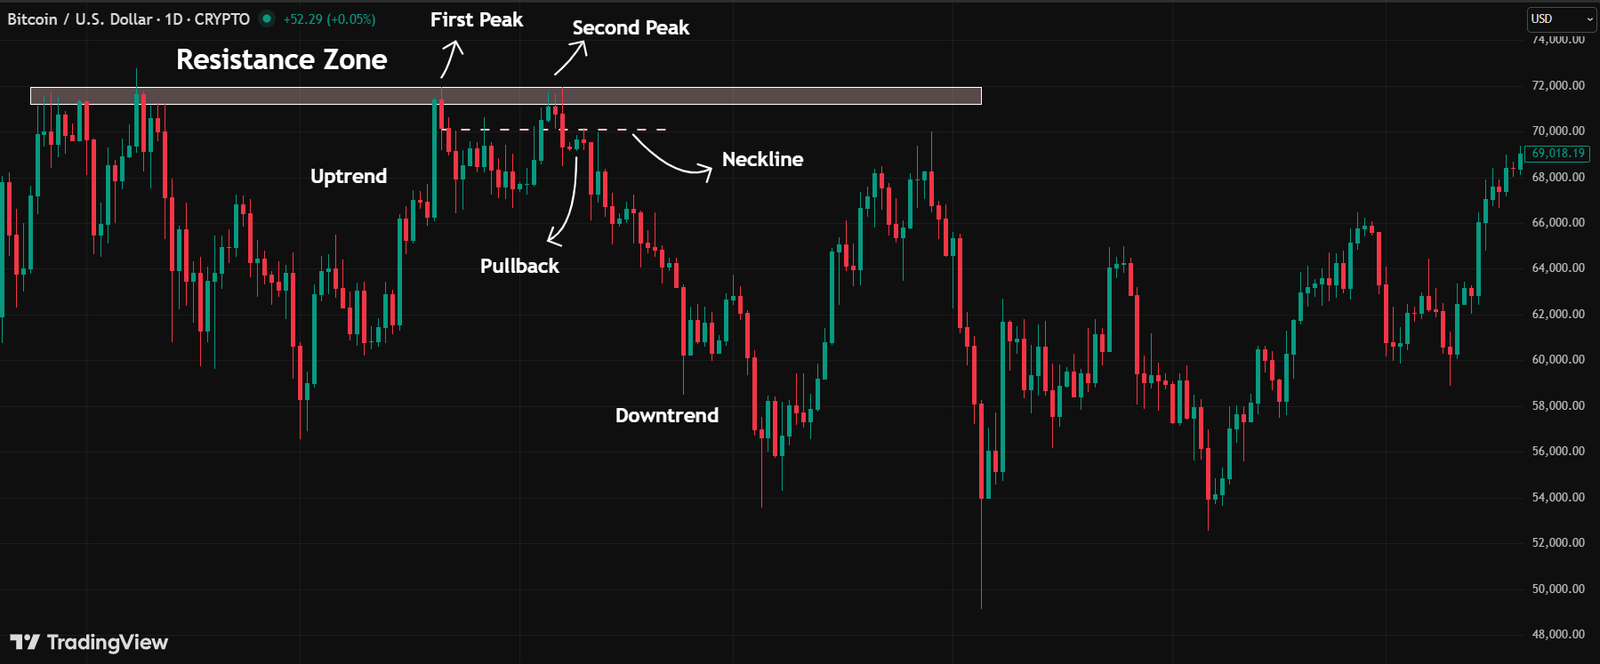
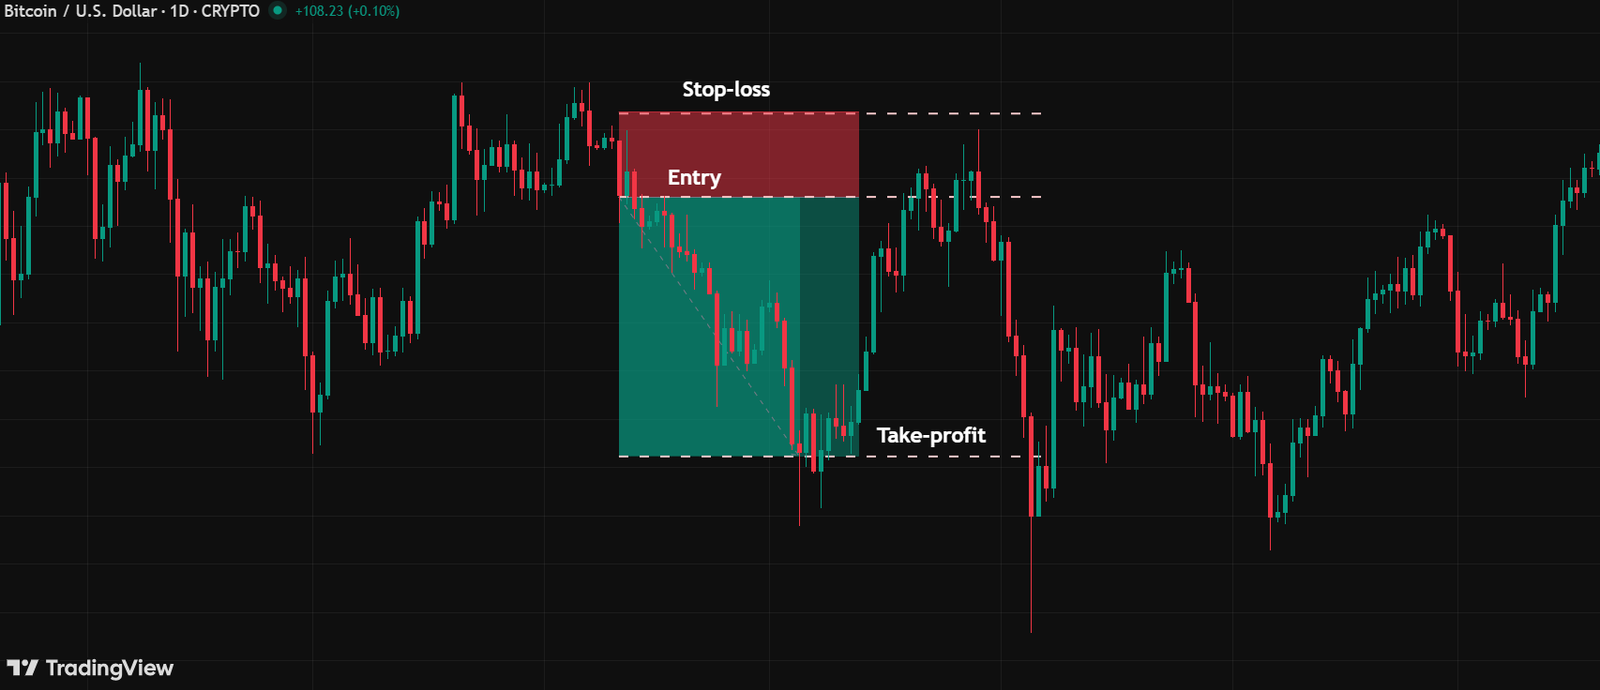
Here’s my favorite chart: BTC. As you can see, the price was moving upward strongly until it finally reached a resistance level. At that point, it created a new high, but soon after, it pulled back for a short retracement. This retracement showed that sellers were starting to push back, but the story didn’t end there.
The price then tried to resume its upward move, aiming for another higher high. However, selling pressure stepped in once again. Instead of breaking higher, the price stalled right at the level of the first peak. This failure to create a new high formed the second top of the pattern.
From here, the neckline was drawn between the two peaks of the double top chart pattern. Once the price broke below this neckline, it didn’t just fall straight away; it came back to retest the line, creating a pullback. This retest acted as confirmation, turning the pattern into a valid setup for a short trade.
So, based on this BTC scenario, here’s how the trade could’ve been managed step by step:
- Double Top Pattern Entry: After the pullback, you’d enter short once a bearish candle closed below the neckline.
- Stop-Loss: To protect yourself, place it just above the neckline.
- Double Top Pattern Target: Target the previous swing lows, giving you a clean exit point.
Double Bottom Chart Pattern Example
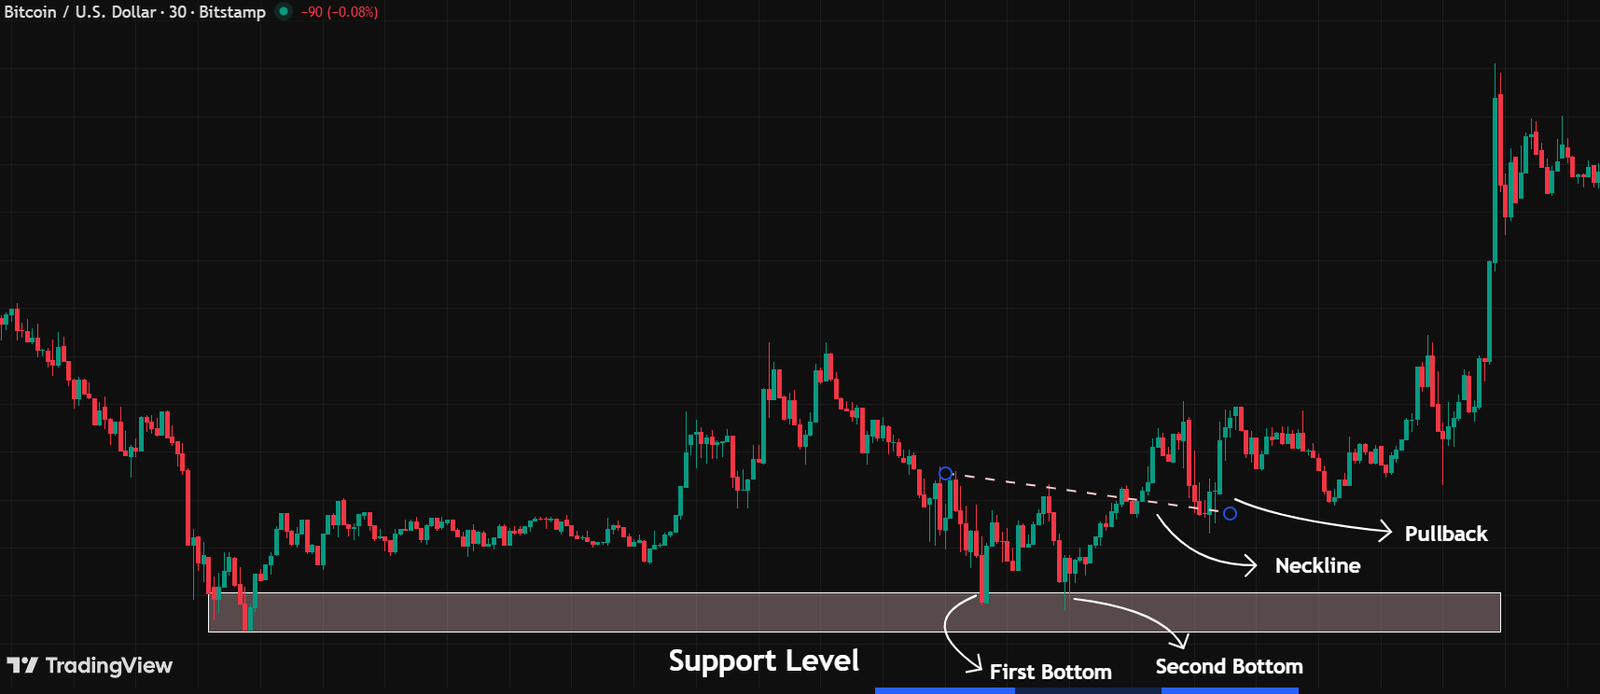
In this scenario, the price was moving downward until it reached a support level. In this area, it formed a low, bounced up into a retracement zone, and then dropped back down to test the same support level again. This second dip created the classic “double bottom” pattern.
The neckline is drawn across the high point between the two bottoms. When the price broke above the neckline and then made a small pullback, the pattern was confirmed. Basically, that’s your cue to go long.
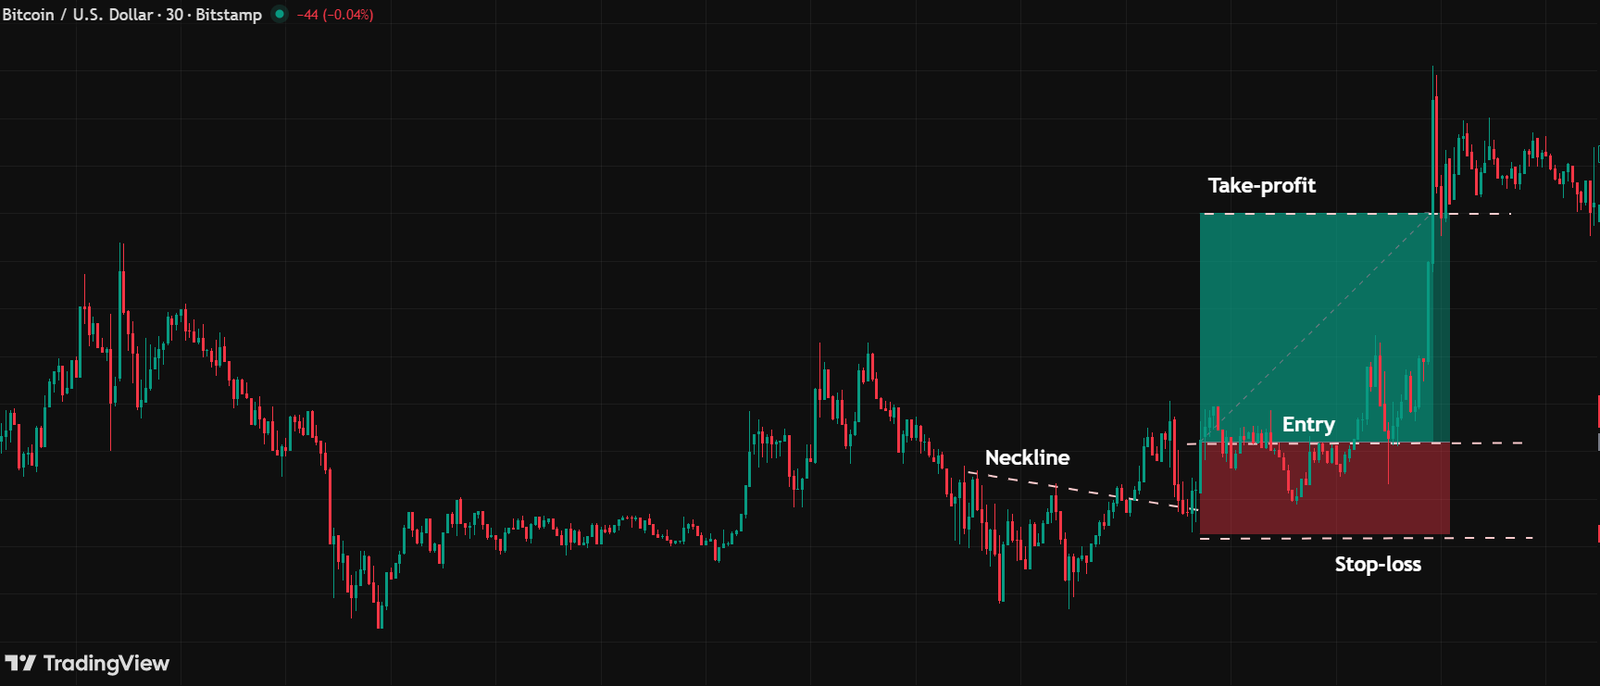
From this setup, you could:
- Double Bottom Pattern Entry: Enter the trade once a bullish candle closes after the pullback.
- Stop-loss Replacement: Place your stop loss just below the neckline.
- Double Bottom Pattern Target: Set your take profit around or above the previous swing highs.
Conclusion
Well, that’s all about my two favorite reversal patterns: the double top pattern and its reversed version, the double bottom pattern. I’ve shared all the key details I know, along with two real examples, so you can see how these patterns work in action.
I hope this article helps you better understand and apply these setups in your own trading. Make sure to follow the Crypoptionhub blog for more trading tips, and don’t forget to practice every pattern thoroughly before going live.
FAQ
What is the pattern of a double top and bottom?
A double top involves two tops, and a double bottom involves two lows or bottoms, as the names suggest.
Is a double top bullish?
No. A double top is a bearish reversal pattern that appears at the end of an uptrend.
Is a double bottom bullish?
Yes. A double bottom is a bullish reversal pattern that appears at the end of a downtrend.


