What if you could spot a trend and momentum before the price of an asset even starts to change? Sounds kinda wild at first, right? I mean, how can anyone predict where the price is going before it even shows any signs?
Well, with the right tools, you actually can catch any changes and shifts in momentum, even before the price reacts.
In fact, momentum can change before the price itself. When momentum shifts, it often signals that a price change is just around the corner, although the price may not immediately follow suit. Just picture being one step ahead of the crowd. That’s the magic of Accelerator Oscillator (AC): It gives you a solid edge in guessing what’s coming next.
If it’s your first time hearing about it, you might be thinking, “How to use the accelerator oscillator?”
No worries, this article’s got you covered. In this article, we’ll walk you through what the Acceleration Oscillator is, how to use it, and share one of the most effective strategies to trade with it.
- The Accelerator Oscillator (AC) helps spot changes in momentum before the actual price movement, giving traders a potential edge in predicting market direction.
- Developed by Bill Williams, the AC is a more refined version of the Awesome Oscillator and is used to identify the acceleration or deceleration of market momentum.
- A practical strategy involves entering a long trade after two green bars above the zero line, and entering a short position after two red bars below the zero line.
What Is an Accelerator Oscillator?
It’s kinda like asking, “Is the momentum picking up speed, slowing down, or changing direction?”
The Accelerator Oscillator, also known as Bill Williams’ Accelerator Oscillator or simply the AC Indicator, is a technical tool used to spot the momentum and strength behind market trends. It was developed by Bill Williams, a trader and psychologist known for bringing Chaos Theory into the world of trading to better explain market behavior.
However, this indicator isn’t the only tool Bill Williams has created. He also introduced the Awesome Oscillator (AO), which helps measure market momentum across different timeframes. The AC indicator is actually an improved and more refined version of the AO, first introduced in his book Trading Chaos back in 1995.
Since the mid-90s, the AC has become a popular choice among traders. In the next sections, I’ll break down how to use it and cover all the key details.
Besides the AC indicator, you might’ve also heard of other tools like the Chande Momentum Oscillator. Feel free to check out our article!
How Does the Accelerator Oscillator Work?
As mentioned earlier, the Accelerator Oscillator is used to spot how strong a trend is, how quickly it’s changing, and whether there might be a shift in momentum or even a possible trend reversal.
Visually, as shown below, the AC Indicator appears as a series of bars that move above and below a zero line.
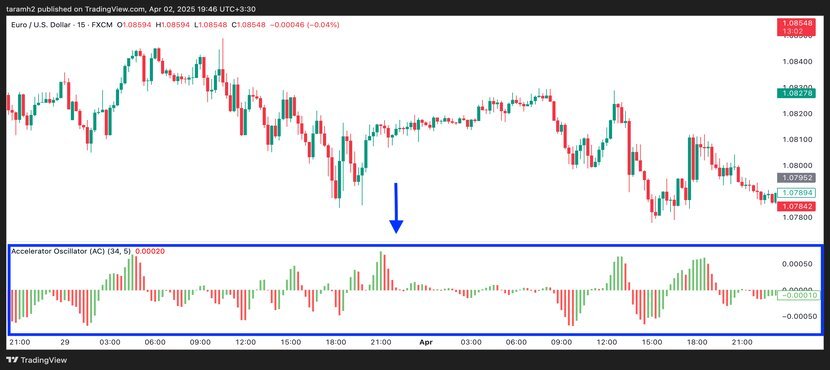
To get a sense of the momentum, just watch those bars:
- When the bars are above the zero line, it suggests accelerating bullish momentum; a potential signal to enter a long (buy) position. This bullish trend gets confirmed when you see two green bars, with the second one taller than the first, both sitting above the zero line.
- When the bars are below the zero line, it points to accelerating bearish momentum; a possible cue to go short (sell). This bearish trend is confirmed when two red bars, with the second taller than the first, appear below the zero line.
The AC Indicator can also help you catch trend reversals. Here’s what to look for:
- If the AC crosses below the zero line and you see three green bars in a row, there’s a good chance of a bullish reversal; this could be your cue to go long.
- On the flip side, if the AC crosses above the zero line and you notice three red bars in a row, it may signal a shift from bullish to bearish momentum; this might be the time to go short.
| Condition | Signal | Action | Details |
|---|---|---|---|
| Bars above the zero line | Bullish Momentum | Go Long (Buy) | Confirmed when 2 green bars, with the second taller, appear above the zero line. |
| Bars below the zero line | Bearish Momentum | Go Short (Sell) | Confirmed when 2 red bars, with the second taller, appear below the zero line. |
| AC crosses below the zero line + 3 green bars in a row | Bullish Reversal | Go Long (Buy) | Signals a possible trend reversal to the upside. |
| AC crosses above the zero line + 3 red bars in a row | Bearish Reversal | Go Short (Sell) | Signals a possible trend reversal to the downside. |
Formula of Accelerator Oscillator
Similar to other technical indicators, such as MACD or RSI, which have unique formulas, the AC indicator is also based on a specific calculation that helps identify trends and potential reversals in the market.
It is calculated by subtracting the Awesome Oscillator (AO) and its 5-period simple moving average (SMA):
As you can see, the accelerator oscillator formula involves two key components:
- The Awesome Oscillator (AO) measures the momentum of the market.
- The 5-period SMA of the AO smooths the AO to help identify acceleration or deceleration in momentum.
Finally, the visual representation of this calculation is shown as several bars (a histogram) on a chart, indicating momentum acceleration or deceleration.
Using Accelerator Oscillator on TradingView
Alright, so we’ve covered the basics of the AC indicator and also introduced the Awesome Oscillator (AO), which the AC is actually built upon. So, if someone ever asks, “What’s the Accelerator Oscillator?”, you’ll be ready with a clear answer.
But let’s be real: knowing what it is and actually using it on a chart are two different things. It can get a little tricky when you’re trying to interpret it in real-time. That’s why in this section, I’ll walk you through how to apply this indicator to a chart and how to use it alongside a trading strategy.
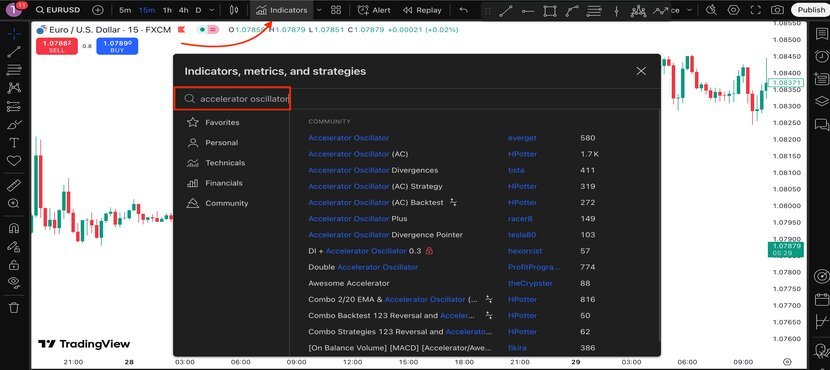
If you’re using a platform like TradingView, just head to the indicators menu, search for “Accelerator Oscillator,” and add it to your chart. From there, you can start analyzing it based on the asset you’re trading.
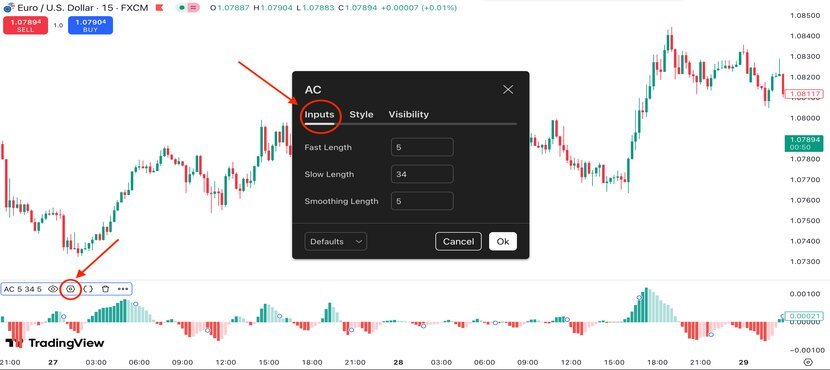
You can customize the settings by clicking on the settings icon and adjusting the input values, as shown in the image below. For example, the default input is usually set to (5,34,5). But if you’re trading on shorter timeframes and want faster signals, you can try (3,21,4). On the other hand, for longer timeframes where you want to filter out more market noise, (8,34,6) might work better.
On TradingView, you can also set the accelerator oscillator alert for your trades. For example, you can create alerts when:
- The color of the AC indicator changes (momentum shift)
- The Indicator crosses zero (very important level)
- You get 2 bars (same color) in a row (stronger buy or sell confirmation)
To do this:
1- Click on the 3 dots on the AC name.
2- Choose “Add Alert on…“
3- Choose your condition like: “AC crosses above 0” = Buy zone

Understanding Accelerator Oscillator: Real Example
In the picture below, you can see that the price reached a support level but couldn’t break below it. When I added the Accelerator Oscillator to the chart, I saw three green bars below the zero line. This suggests that the downtrend is getting weaker, and a possible trend reversal might be coming. Remember when I talked about this kind of signal earlier? This is exactly that moment!
At the same time, a bullish candle appears as the price hits the resistance level: another hint that an uptrend could be starting.
Also, look at the green circle on the chart. It shows several tall green bars in a row, which gives even more confirmation of a strong bullish trend forming.

Based on my personal strategy, I would enter a long position after seeing two green bars above the zero line, which is marked by the blue flash in the picture below.
For managing the trade, I’d place my take-profit around the previous resistance zones, and set my stop-loss just below the previous swing low or support area, to protect the trade in case the market moves the other way.

Trading Binary Options with Accelerator Oscillator
If you want to trade binary options using the Accelerator Oscillator (AC), you can try the Pocket Option trading platform. To apply the AC Indicator on Pocket Option, just click on the “Indicators” section, then find and select it from the list on the left side.

After adding the indicator to your chart, you can also adjust the inputs by clicking on the pencil icon. From there, you can change the period settings to better match your trading style or timeframe.
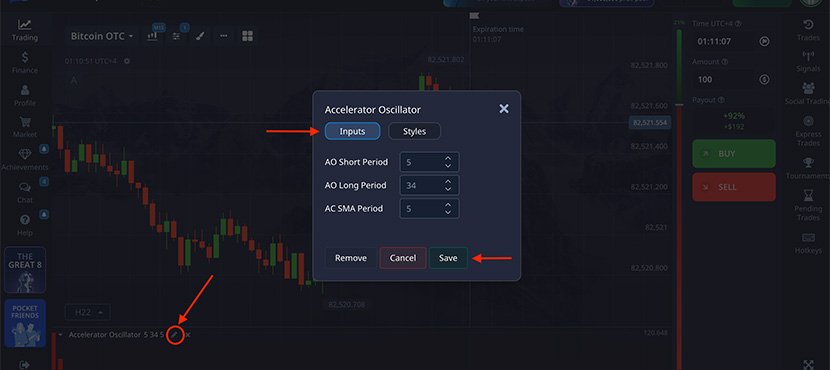
Once you’ve added the indicator to your chart, you’re ready to start trading. Here’s how I use this indicator with binary options.
This example shows a Bitcoin binary options chart. As you can see, the price reached a resistance level but couldn’t break through it. At the same time, there are some bearish red candles, and the AC Indicator shows strong red bars below the zero line.
Based on the same strategy I used earlier on TradingView, this setup gives a signal to go for a sell. Specifically, when the second red bar appears below the zero line, it suggests a downtrend is starting, and that could be your entry point. Want to build the best strategy for yourself? Our article on ‘Binary Options Strategy‘ can really help you get started.

Pro Tips for Using Bill Williams Accelerator Oscillator
So far, we’ve covered all the details of using the AC indicator on platforms like TradingView and PocketOption. To help you get better results while trading with this indicator, we’ve also shared some helpful tips below:
- Practice with Demo Account: A demo account is your safe and free area to practice, and once you’re comfortable, you can start trading with your real money.
- Use Accelerator Oscillator with other indicators: Combining the AC indicator with other indicators such as the Vortex Indicator or the DMI Indicator can help you make more reliable trading decisions.
- Confirm signal with other price action: Relying only on one indicator is not enough; try to understand price action and see if it matches the signals from your indicators for more accurate analysis.
- Avoid overtrading: We know that it’s tempting, but don’t overtrade. Take your time and wait for valid confirmations.
- Use risk management tools and techniques: Save your money with tools like stop losses and position sizing to make sure you’re always in control of your risk.
- Backtest your strategy: Don’t skip the backtesting. Seeing how your strategy worked in the past can give you valuable insight before going live!
Conclusion
So here’s the deal: think of the accelerator oscillator like a car’s speedometer: it shows you how fast momentum is picking up or slowing down, and it helps you spot those moments when things might change direction.
If you’ve made it this far, you should now have a good grasp on how it works and how to trade with it on platforms like TradingView and Pocket Option for Binary Options.
We’d love to hear about your experience with it, too! If you’ve used this indicator alongside other tools and gotten some awesome results, or if you’ve got any other strategies, share them with us in the comment section! You can also find more trading strategies with other indicators on CrypOptionhub blog.
FAQ
How to read an Accelerator Oscillator indicator?
Green bars above the zero line suggest strengthening bullish momentum, while red bars below the zero line suggest strengthening bearish momentum.
What is the difference between Awesome Oscillator and Accelerator Oscillator?
Green bars above the zero line suggest strengthening bullish momentum, while red bars below the zero line suggest strengthening bearish momentum.
What is the difference between Awesome Oscillator and Accelerator Oscillator?
The Awesome Oscillator shows momentum, while the Accelerator Oscillator shows its speed change.


