Ever get that feeling like you’re not sure if the market’s heading the right way? Yeah, it happens to all of us! That’s where the DMI indicator comes in. It’s a useful tool to spot strong trends and show you which way the market is moving, so you don’t get stuck in confusing ups and downs.
In this article, I’ll explain what the DMI indicator is, how to read it, and even walk you through a DMI practical strategy. Trust me, you won’t want to miss this one!
- The DMI consists of three lines: +DI, -DI, and ADX. +DI and -DI show trend direction, while ADX measures trend strength.
- When +DI is above -DI, it signals an uptrend. When -DI is above +DI, it indicates a downtrend.
- ADX values above 25 suggest a strong trend, while below 20 signals a weak trend.
- Combine DMI with other indicators for better trend confirmation and to spot reversals.
Where Does the DMI Indicator Come From?
It’s been proven over and over that when you’re learning something new, whether it’s a technical concept or anything else, starting from the basics really helps you understand it better. That’s exactly how I want to explain the DMI indicator to you!
So, DMI stands for Directional Movement Index. It was created by J. Welles Wilder back in 1978 as part of his book “New Concepts in Technical Trading Systems”. You might find it interesting that Wilder also developed other well-known indicators like the RSI and Average True Range (ATR). I personally use the RSI a lot in my trades!
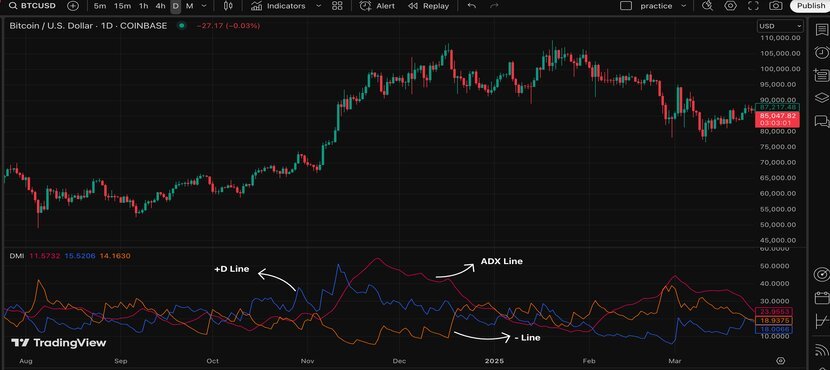
The DMI indicator is made up of three lines: +D, -D, and the ADX line. On some platforms, the ADX line is shown as a separate indicator, and on some others, the whole DMI indicator might be called the ADX indicator too.
Stick with me as I explain how the DMI indicator works and break it all down for you in the next section!
How Does the DMI Indicator Work?
The DMI indicator is great for figuring out the current direction and strength of a trend. Unlike some other indicators, such as the accelerator oscillator, which focuses on crossovers and predicting reversals, the DMI is all about showing you what’s happening right now and how strong the trend is. The two D lines work together to show the trend direction, while the ADX line tells you how strong that trend is.
To understand how it works, just follow the lines:
- +D Line (Positive Directional Movement): This happens when the price moves higher than the previous period’s high. When this line is above the -D line, there is an uptrend.
- -D Line (Negative Directional Movement): This happens when the price moves lower than the previous period’s low. When this line is above the +D line, there is a downtrend.
- ADX Line: The ADX line ranges from 0 to 100. A value above 25 usually means there’s a strong trend, while below 20 suggests a weak or non-trending market. As I mentioned earlier, many platforms use the ADX line as a separate tool, and I’ve also talked about it in more detail in our article on the ADX indicator.
How to use the DMI Indicator on TradingView
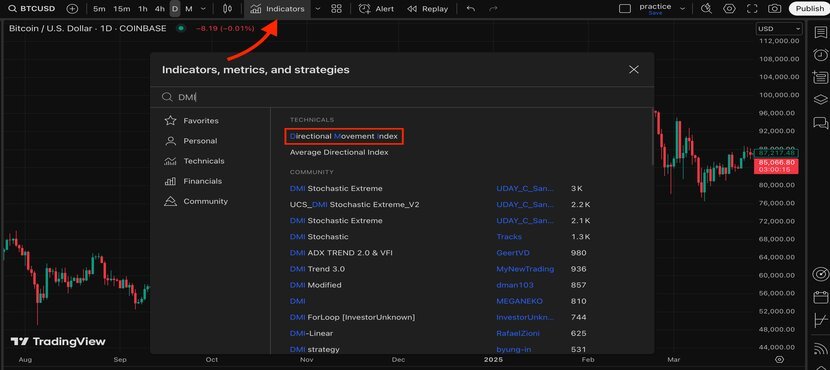
Alright, let’s talk about TradingView for a second; it’s one of the most popular platforms for technical trading, and honestly, I really enjoy using it. So, if you want to use the DMI indicator, just head over to the indicator section, search for it, and add it to your chart. That’s all!
Now, when you add the DMI, you’ll notice three lines pop up on the chart, like the ones you see below. Different platforms might show them in different colors, but here’s how it looks for me:
- The blue line is the +D
- The yellow line represents the -D
- And the red one is the ADX line.
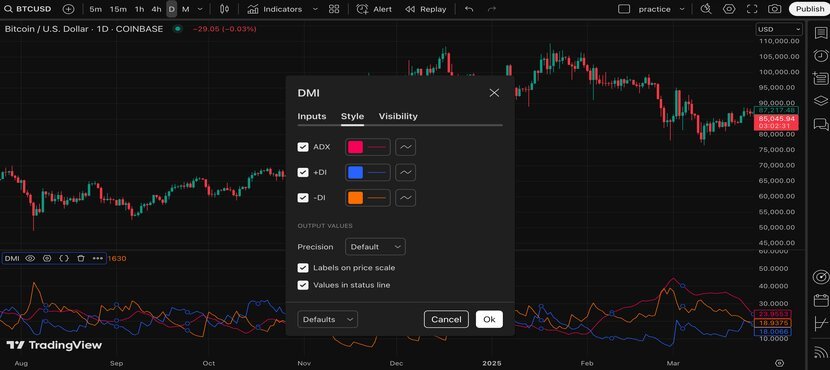
If you want to change anything, like the colors, inputs, or how it shows up on different timeframes, you can do that by clicking the settings in the bottom left. It’s super easy!
Using the DMI Indicator when Trading Binary Options
Alright, let’s dive into another trading platform: Pocket Option, which is pretty useful for binary options trading.
Getting started is simple. Just choose the DMI indicator from the indicator section at the top, and you’re good to go. But here’s the thing: on Pocket Option, you must choose the ADX indicator, which also includes the D lines.
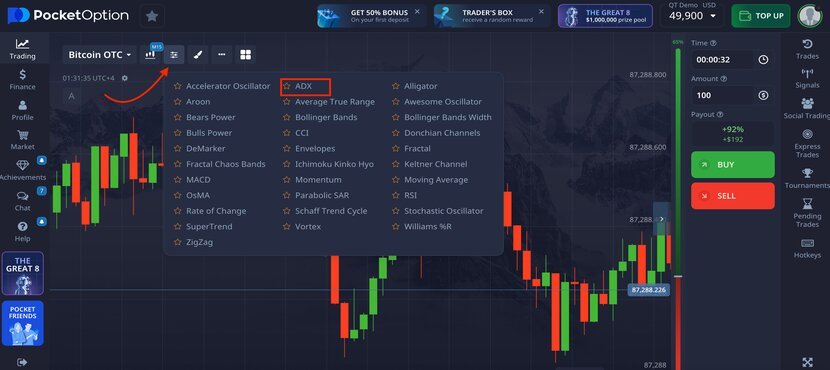
So, just like I mentioned earlier, you can jump right into binary options trading once you have that setup. If you want to change the colors or other settings, just click on the pencil icon you see highlighted in the image below. Easy, easy!

Now, some of you might have heard about trading bots for binary options. If you’re not sure what they are or just curious to learn more, check out our article on binary option trading bots. It’ll give you the lowdown.
Also, to make your binary options trading experience even better, you can use other helpful technical tools. We’ve got a list of the best indicators for binary options in our article called “The Best Indicators for Binary Options.” It’s definitely worth a look!
The DMI Indicator Trading Strategy
So, we’ve already discussed how to read the DMI indicator on different platforms. Now, I want to show you how I actually use it in my own strategy on the Bitcoin chart, one of my favorites!
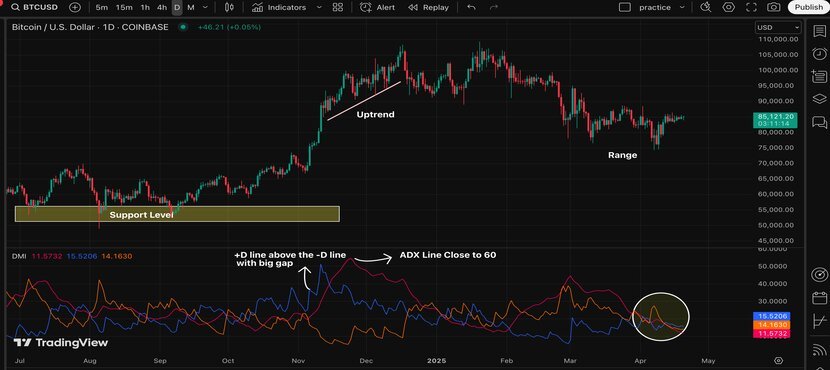
If we look at the BTC daily chart, the DMI indicator helps us spot the trend and understand its strength. Based on the image below, we can see that the +DI line was above the -DI line, showing us that we’re in an uptrend. Looking at the top of the trend, when the price hit a resistance area, the DMI indicator also showed that the trend was losing strength, with the two D lines getting closer. This was the moment the price reached the resistance level. At that point, I just needed to figure out whether the price would reverse or keep moving up.
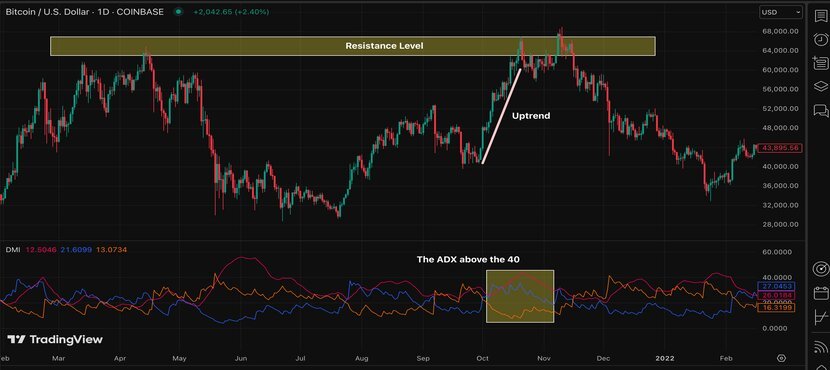
But here’s the thing: I couldn’t just rely on the DMI alone to predict BTC’s next move! That’s why I wanted to use the RSI indicator as well. If you’re not familiar with the RSI, don’t worry, there are other options like the Aroon indicator that can work just as well.
By checking the RSI, I could get a better idea of where the momentum was headed, whether the trend would keep going or if a reversal might be coming.
In this case, the RSI showed a bearish divergence. Additionally, I noticed a bearish head and shoulders pattern forming, and the price broke out of the neckline and then created a pullback.
Feeling even more confident about the bearish reversal, with a bearish engulfing candlestick pattern. That’s exactly when I decided to go for a short position.

This was a simple example of how I combined the DMI indicator with momentum indicators like the RSI and added a bit of price action. If you’re thinking of using the DMI indicator, I highly recommend pairing it with another indicator for confirmation.
The DMI Indicator Formula
Okay, let’s break it down! You don’t really need to worry about the formula when using the DMI indicator. Honestly, before I wrote this article, I didn’t know the exact calculation either, and I’ve used it a lot! Imagine having to calculate all that stuff every time you use it. Sounds like a headache!
The formula looks complicated, but that’s not what matters. What’s important is how these lines move and how they interact with each other. That’s where the key information is.
Anyway, here’s the formula if you’re curious:
- +DI = Smoothed ∑(Current High – Previous High) × 100 / TR
- −DI = Smoothed ∑(Previous Low – Current Low) × 100 / TR
- And TR (True Range) is calculated like this: TR = max(Current High – Current Low, |Current High – Previous Close|, |Current Low – Previous Close|)
But like I said, don’t stress about the details. Just focus on how the lines move and what they’re telling you. That’s where you’ll get the useful info.
How to Use the DMI Indicator On Other Platforms?
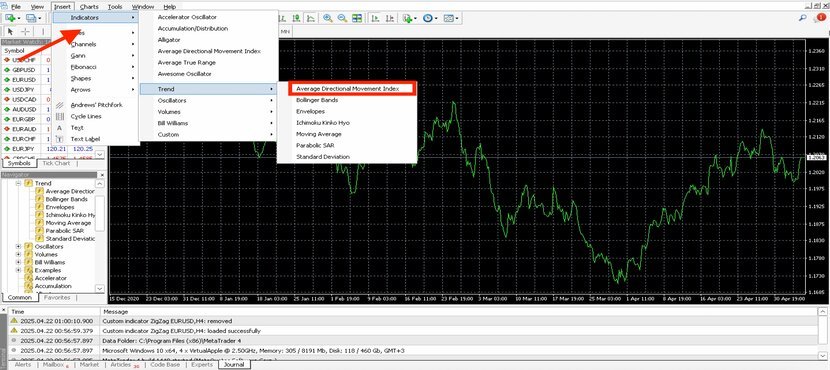
The DMI indicator works the same way across different trading platforms. For example, if you’re using the MetaTrader platform (MT4), it’s super easy to add it. Just go to the top menu, click on “Insert,” and then select “Movement Direction Index.” Based on what I explained above, and even using my strategy, you can read it on MT4 too.
Top Tips When Trading with the DMI Indicator
Well, I’m here to share my trading knowledge, and I’m always happy to give you some hints, this time about the DMI indicator:
- First things first, don’t let the name confuse you. On many platforms, it’s actually shown as the ADX indicator. If you see just one line, that’s the ADX line, and it’s used to measure trend strength. But if you see three lines, that’s when you can also check the direction of the trend.
- I do want to say, though, that using only the DMI indicator to make trading decisions isn’t enough. I really recommend combining it with other tools such as the Vortex indicator or looking at price action, too.
- And don’t ever forget risk management. The market can be unpredictable, and your stop loss is there to keep you safe when things don’t go as planned.
Conclusion
I hope this guide helped you understand the DMI indicator better! After reading this article, I recommend you open a trading platform like TradingView. Choose the DMI indicator and start practicing with different price charts. Try experimenting with other indicators too: that’s how you’ll really master it! If you’re not familiar with other indicators yet, don’t worry. Start by learning this one, and then you can explore the others through our educational resources at the Crypoptionhub blog.
If you have any questions about the DMI indicator, feel free to ask them in the comments. I’m happy to help!


