You’ve probably heard about different indicators; maybe you even know how to use some of them. Many of these tools are great for spotting where a trend might be heading. If you’ve ever worked with oscillators like the Accelerator indicator, then you know what I’m talking about.
But here’s the thing: Not every situation is about predicting what’s next. Sometimes, you just want to get a clear picture of what has already happened: Was that really a trend? Did the price just reverse? Are we seeing a pattern here? That’s where lagging indicators come in handy.
The one I personally use is the ZigZag indicator. In this article, I’ll break down what the Zig Zag indicator is, how to read it, and how you can use it across different trading platforms.
- The Zig Zag indicator clears out the small, random price moves so you can focus on the real trends. It helps you see if something was actually a trend or just noise.
- Zigzag trading indicator isn’t for guessing where the market is going. Instead, it helps you understand what already happened, like if a trend really reversed or not.
- You can set the inputs like minimum price movement before the Zig Zag draws a new line on your chart. Smaller inputs are good for short-term trading, bigger for longer timeframes.
- The Zig Zag alone doesn’t tell you when to buy or sell. But if you use it with other tools, it can really help you develop a stronger trading plan.
What Is the Zig Zag Indicator?
I know that I’m here to talk about the ZigZag trading indicator, but before I dive in, let me tell you a quick and helpful story.
A few months ago, I tried photography. One of the things I learned was how to use the “bokeh” effect. You know, that soft blur in the background that helps your subject stand out? It really came in handy to me, especially when I had to shoot in crowded or messy situations. The bokeh effect removed all that background clutter and made it easier to focus on what actually mattered in the shot.
Well, that’s kind of what the Zigzag indicator does in trading. It filters out all the “noise” on the charts; the random little price movements that don’t mean much! So you can see the bigger picture of the chart more clearly. It helps highlight the real trends and key price swings, just like how bokeh helps me to focus on the subjects. Now, just a heads-up: the Zig Zag indicator doesn’t actually give you specific buy or sell signals. It’s more about helping you understand what’s going on.
Read More: If you’re looking for something that gives you entry or exit points, you might want to check out our guide on “The Ultimate Aroon Indicator Tutorial”.

How Does the ZigZag Indicator Work?
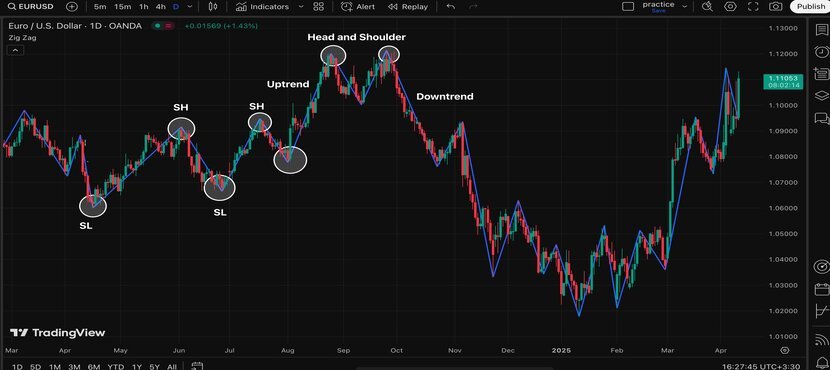
When you’re using the Zig Zag indicator, what you’ll actually see on the chart are lines that only show up when the price of the asset moves noticeably, like from a swing high to a swing low. Basically, the Zigzag connects the more important highs and lows so you can get a clearer and big-picture view of what the market’s doing.
Remember earlier when I mentioned that this indicator filters out “noise”? What I meant is that it doesn’t react to every tiny move in prices. Instead, it waits for the price to move by a certain minimum percentage (it’s named threshold or deviation on the settings) before it draws a new line. That way, you’re not distracted by every little blip on the chart.
Let’s say you choose 5% for minimum price movements. That means the indicator will only draw a new line when the price moves more than 5%. Anything less than this 5%? It just ignores it.
Zig Zag Indicator Formula
I also explained the zigzag indicator formula below to cover everything about it. But the indicator does this calculation itself, so you no longer need to calculate anything. So, here’s the code:
If %change ≥ X, plot ZigZag
Where:
- High-Low: is the highest and lowest prices in each period.
- %change = X: This is how the price change needs to be (in percent) before drawing a new line.
How to Use the ZigZag Indicator on TradingView
Now that you understand what the Zig Zag indicator is and how it works, let’s talk about how to use it on a platform like TradingView.
To add it to your chart, just go to the indicators section and type “Zig Zag.” That’s all it takes.
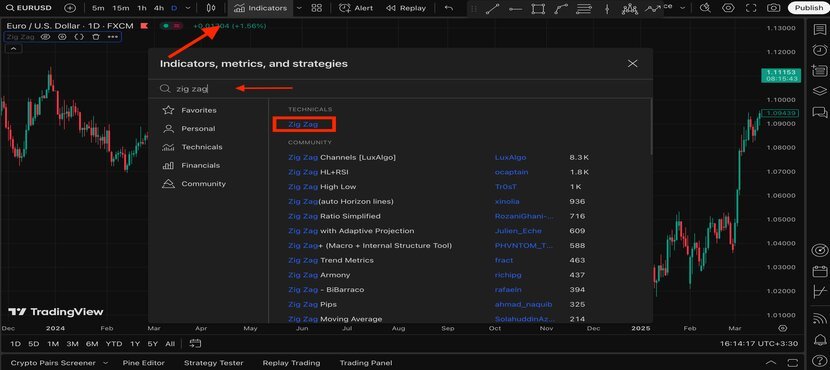
After you add it, you’ll see a line between the swing highs and swing lows. This makes trends, reversals, and chart patterns, like the head and shoulders, much easier to spot.
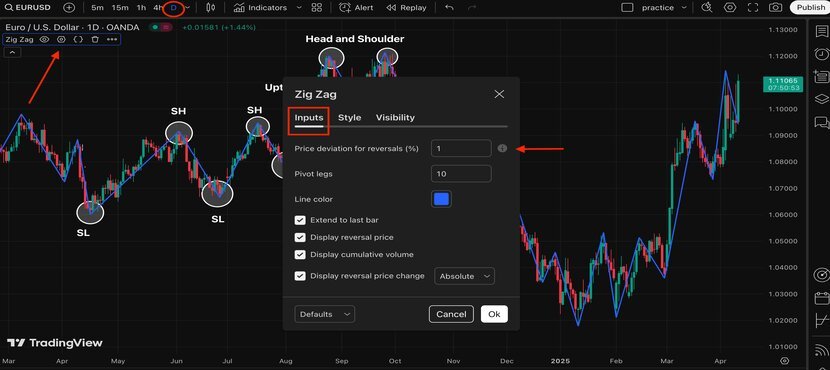
If you want to change the settings, just click the settings icon, go to the “Inputs” tab, and you’ll see all the options there.
How to Use the Zig Zag Indicator on the MT4 and MT5 Platforms
MetaTrader (versions 4 and 5) is one of the most popular trading platforms. It supports various trading tools, including the zigzag indicator.
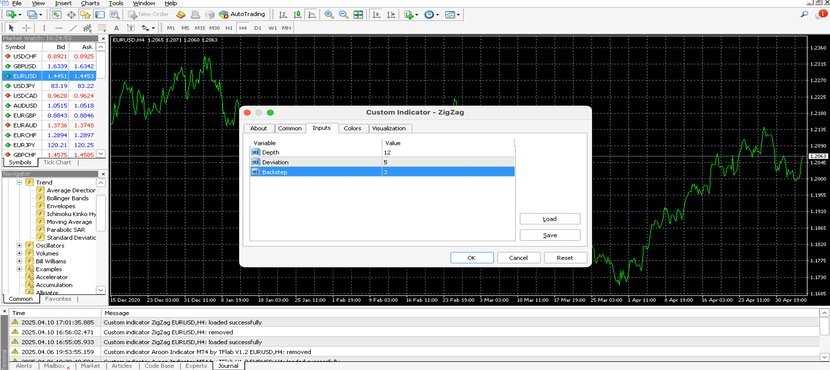
As shown in the image below, here’s how to add this indicator on MT4 and MT5:
- Click on Insert
- Select Indicators
- Then go to Custom and scroll down to find ZigZag at the bottom
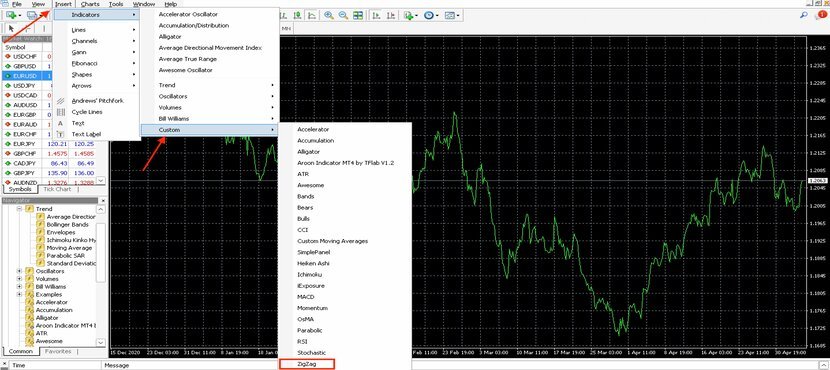
After you select it, a small window will pop up. This is where you can set the settings based on your needs.
How to Use the ZigZag Indicator on the Pocket Option Platform
As many people are interested in binary options trading these days, I want to explain how you can use the zig zag indicator on binary option platforms, such as the Pocket Option.
Here’s some good news: You can use promo codes to unlock extra features. To make sure you don’t miss anything, check out the “Pocket Option Promo Codes 2025.”
Now, here’s how to use the Zig Zag indicator on Pocket Option:
- Click the Indicators icon at the top of the screen.
- Scroll down a little and select Zig Zag to add it to your chart.
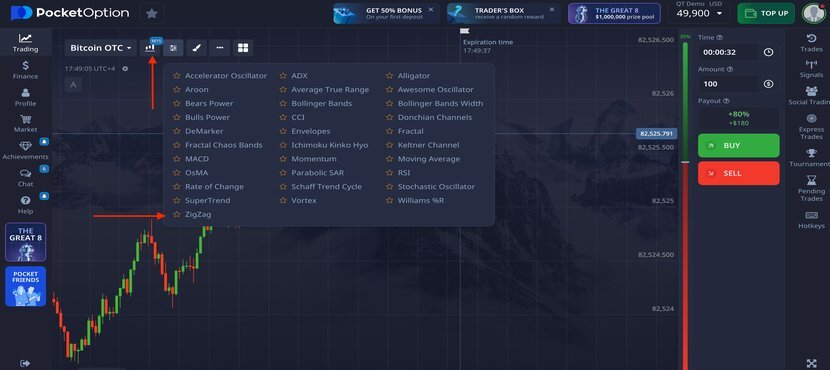
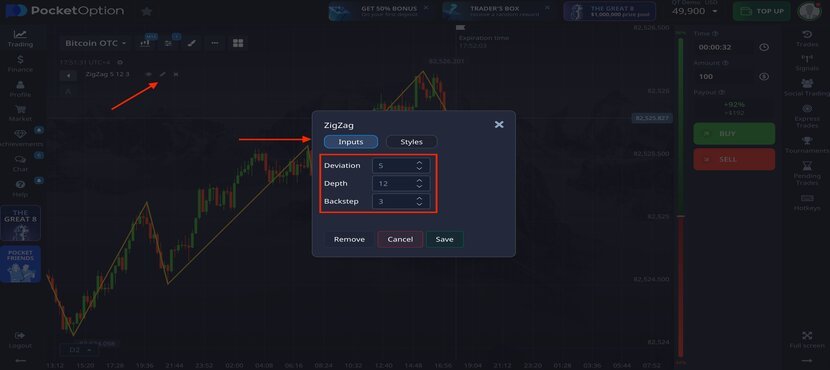
To change the settings, just click the pencil icon (as you see in the image below). That’s where you can adjust the inputs as needed.
Read More: OBSignals Review 2025: Free Binary Options Signals Generator
What Are the Best Settings for the Zig Zag Indicator?
Just like other indicators, such as the Accelerator Oscillator, the Zig Zag indicator also has some input settings, like the threshold or deviation that I talked about earlier. You can adjust these settings depending on the timeframe you’re trading, your trading style. You can not find two people with the exact trading style in all cases. That’s why there’s no single “perfect” setting that works for everyone.
For example, zigzag indicator setting for intraday could be set on 2-3 %. On higher timeframes, like weekly charts, you might want to increase the threshold to around 8–10%. It’s better to backtest different settings within different timeframes to get the best setting based on your own strategy.
Read More: Best Time to Trade Binary Options
Understanding Zigzag Indicator Strategy: Practical Example
The zig zag indicator on its own doesn’t give you entry signals, similar to other tools such as the ADX indicator. They are created to give us hints about the current state of the market. So, if you want to have a solid zig zag indicator strategy, I recommend combining it with other indicators and technical tools.
For example, you can use the zigzag to check the overall trend. Then, to check for possible reversal points, you can use momentum indicators such as the Aroon indicator. On top of that, candlestick patterns (like the hammer candlestick pattern) can give you extra confirmation before you decide to enter a trade.
In the example below, I used the zigzag indicator ( a blue line on the chart) to determine the trend. Then, I wanted to determine whether the trend would continue or reverse. So, I used the Aroon indicator. As we explained in our previous articles, a crossover is often a sign that a trend might be reversed, as shown below.
At the same time, I also identified a bearish head and shoulder pattern, which confirmed a reversal trend from bullish to bearish.
Then, I placed my take profit order near the previous swing low and my stop loss close to the recent resistance level.

Conclusion
That’s all for the Zig Zag indicator! It’s a useful tool for spotting trends and reversals in the market. Keep in mind, it doesn’t predict future trends, it simply filters out small price movements to give you a clearer view of the overall market direction. You can combine it with other technical indicators for better trading results.
Don’t forget to check out the CrypOptionHub blog for more educational and technical content. You can also ask any questions about the Zigzag indicator in the comment section below.


