If you’ve been watching price action for a while, you’ve probably seen those candles with long lower wicks that seem to start bullish reversals. That’s the hammer candlestick pattern. It’s a classic sign of bullish reversal or pullback after a downtrend. I’ve used it many times, and when it forms at the right spot, it can lead to high-probability trades.
But don’t let the simplicity fool you. A hammer candlestick on its own doesn’t mean “buy.” It needs context, confirmation, and a clean setup. In this post, I’ll break down everything about this candlestick pattern.
- The hammer candlestick pattern signals a possible bullish reversal after a downtrend.
- It should form at key levels and be confirmed by the next bullish candle before taking a trade.
- Not every hammer is valid. Context, wick ratio, and market structure matter.
- Relying on candlestick patterns alone can lead to losses. Just use it as an entry signal.
What Is the Hammer Candlestick Pattern?
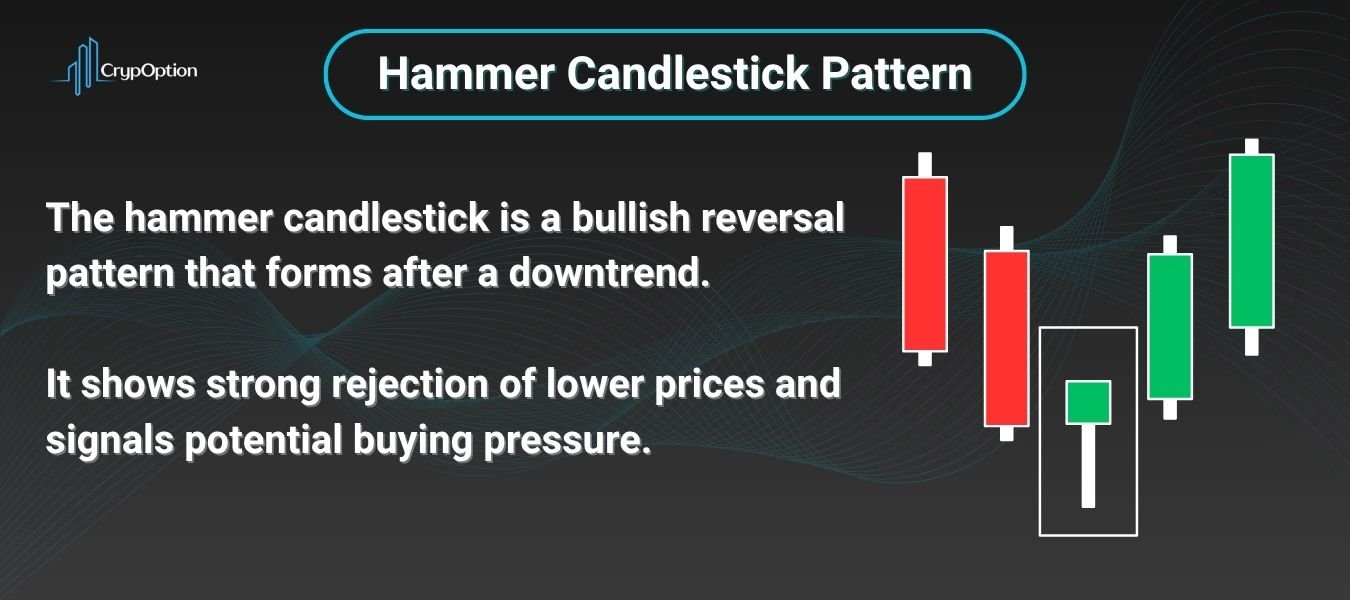
The hammer candlestick pattern is a single-candle formation that signals a possible bullish reversal following a price drop. It’s easy to spot: the candle has a small body near the top and a long lower wick, usually at least two times the size of the body. It looks like a hammer, hence the name.

What makes it powerful is the story behind it. Sellers pushed the price down hard during the session (the candle’s trading time), but buyers stepped in and brought it all the way back near the open. That’s a sign of rejection. A shift in momentum. And if it forms at a key support level or demand zone, it can signal that the bottom might be in.
Here’s the key criteria:
- Small bullish body near the top of the candle
- Long lower shadow, at least 2x the body size
- Little to no upper shadow
- Appears after a downtrend or a deep pullback
Keep in mind, the color of the candle doesn’t matter much. A green (bullish) hammer is stronger, but even a red one can work if the setup is clean.
When and Where the Hammer Pattern Appears
The hammer pattern shows up after a downtrend or a strong bearish move. It’s a sign that sellers are losing control and buyers are starting to step in. But here’s the key: not every hammer candle matters. Context is everything.
The best hammer setups form at key support levels, demand zones, or liquidity pools. If the price has been bleeding for a while and suddenly forms a hammer right at a clean level, that’s your cue to pay attention. It means the market is rejecting lower prices.
You’ll also want to watch the timeframe. Hammers on the 1-minute chart show short-term noise. But on the 1-hour, 4-hour, or daily charts, they hold much more weight. For binary options traders, even a 5-minute hammer can be solid, as long as it aligns with the higher-timeframe structure.
A hammer candlestick pattern is most powerful when it appears after a clean downtrend or sell-off, at a major support or demand zone, and is followed by a bullish confirmation candle. Pay attention, we want this confirmation candle to be a strong one with a large body. You can also pay attention to volume, as the hammer candle pattern mostly forms when significant volume is traded at a potential price low.
And remember, don’t trade it in the middle of a range just because it looks nice. Location and narrative matter more than the candle itself.
Read More: What Is the Dragonfly Doji Candlestick Pattern?
How to Trade the Hammer Candlestick Pattern
The hammer trading pattern is pretty simple to use, but only if you wait for the right setup and follow through with proper risk management.
Here’s how I usually approach it:
Step 1: Identify the Context
Make sure the hammer forms after a clear bearish leg, and not inside a consolidation. Ideally, it should appear at a key support level, demand zone (or order block), bullish Fair Value Gap, or below previous low(s) where the price is likely to sweep liquidity and reverse. Another area I really like to trade hammer patterns from is at the touch or fake breakout of a bullish flag pattern‘s lower trendline.
Step 2: Wait for Confirmation
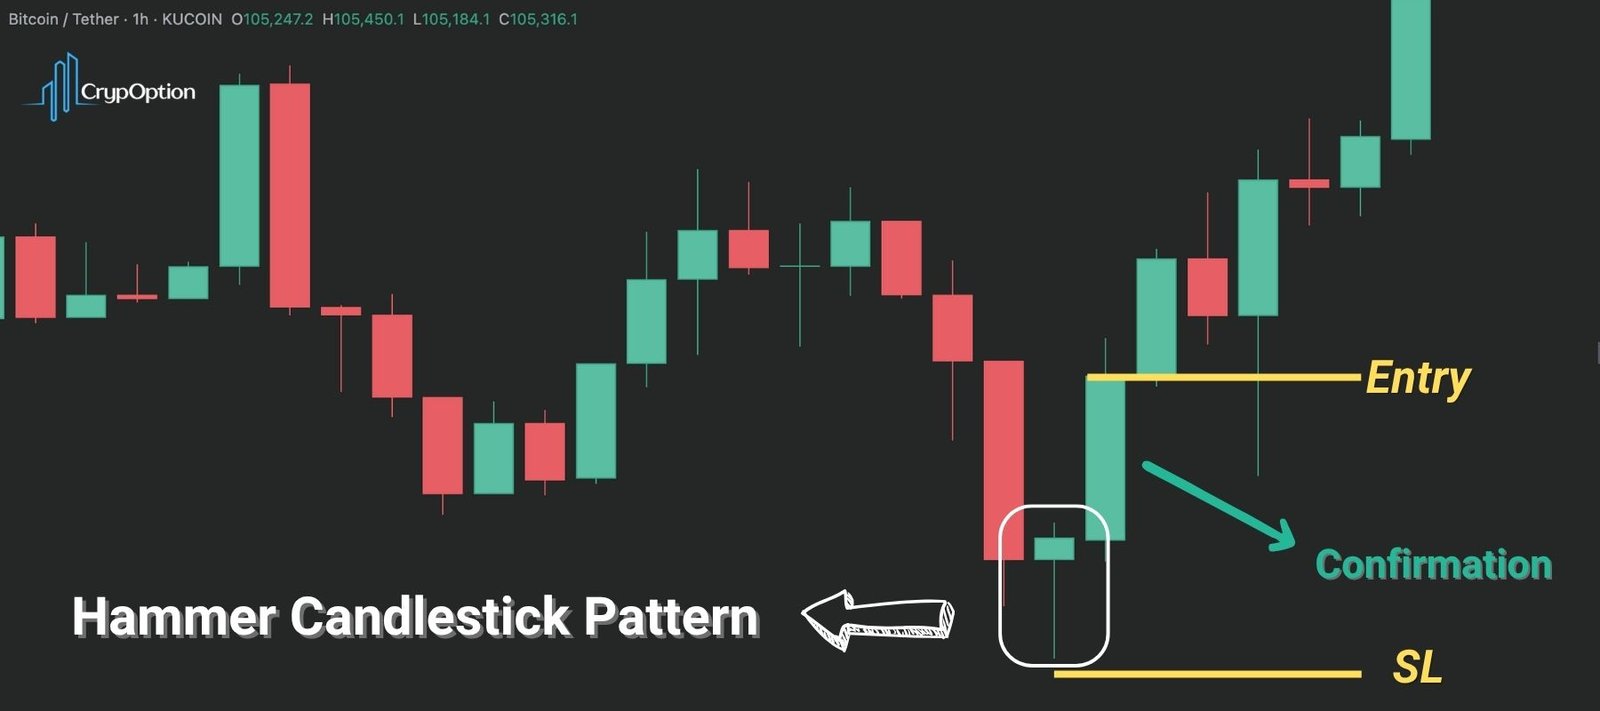
If you want my suggestion, don’t enter right on the hammer close. Wait for the next candle to close bullish and show a rejection from your point of interest (support or demand zone). It should also preferably close above the high of the hammer candlestick. That can be a signal that the bulls are serious and the demand is here to stay for a while.
You can also use other reversal patterns for confirmation, such as the Engulfing pattern, Tweezer Top and Bottom, Dragonfly, and others.
Step 3: Plan Your Entry
This is a step you should already know how to do if you’re a trader, and it really depends on your personality and approach. Yet, generally speaking, you can enter the trade once confirmation is in, on the next candle’s open, or a small pullback.
Step 4: Set a Stop Loss
Again, this should be routine for a trader. If you’re trading CFDs (like forex and indices), place your stop just below the low of the hammer candle. If that low breaks, the pattern is invalidated, and there’s no reason to stay in. However, you can also place it a few points lower, just for a safety cushion, as the price may hunt liquidity twice to trap the hasty buyers.
Oh, and if you’re a binary options trader, skip this step. Just make sure you don’t risk too much, and follow your money management rules.
Step 5: Define Your Target
For binary options, choose an expiry that gives the trade time to move. I usually set my expiration times at 3–5 candles after confirmation. And, for CFD trading, look for the next resistance level or liquidity pool, or even use a fixed 1:2 or 1:3 risk-reward ratio.
The image below is from the Bitcoin chart on TradingView, which shows a clear hammer candlestick pattern example, and how you can trade it.

Common Hammer Mistakes and Lookalikes to Avoid
While the hammer trading pattern is easy to recognize, a lot of traders get it wrong by misreading lookalikes or trading it in the wrong context.
Let me break down what I mean and what to watch out for.
Trading Every Hammer You See
Not every candle with a long lower wick is a valid hammer candle pattern. As I mentioned earlier, if it forms in the middle of a range or during an uptrend, it means nothing. The pattern must come after a clear bearish leg.
Ignoring Confirmation
Jumping in as soon as you spot the hammer? That’s risky. Without confirmation from the next candle or solid price action, you’re just guessing. Wait for a proper signal.
Confusing It with Other Candles
There are other patterns that look like a hammer but mean something completely different:
- Inverted Hammer: Still bullish, but a different formation.
- Hanging Man: Looks exactly like a hammer but forms after an uptrend and is a bearish signal.
- Shooting Star: The real bearish opposite of a hammer, with a long upper wick after a strong bullish move.
Overlooking the Wick Ratio
The lower wick should be at least twice the size of the real body. If the wick is too short or if there’s a big upper shadow, it’s not a clean hammer pattern candlestick.
The Pros and Cons of the Hammer Trading Pattern
Like any price action signal, the hammer candlestick pattern has its strengths and weaknesses. Here are the pros & cons:
| Pros | Cons |
|---|---|
| Easy to identify and recognize on any chart | Can produce false signals without confirmation |
| Works well with support zones, demand areas, or trendlines | Loses effectiveness in choppy or ranging markets |
| Clear stop-loss and entry rules when used properly | Relies heavily on context, as location matters more than the candle |
| Can be used across all timeframes and markets | It can be confused with similar patterns like the hanging man |
Read More: What Is the Gravestone Doji Candlestick Pattern?
Conclusion
The hammer candlestick pattern can be a great signal when used in the right context. It shows a strong rejection of lower prices and can hint at a shift in momentum from sellers to buyers. But like any tool in trading, it’s not magic.
Using candlestick patterns alone, without context, confirmation, or a proper trading plan, will surely lead to losses. Mark my words, they come from years of experience. The hammer trading pattern works best when combined with key levels, market structure, liquidity, or even indicators, not on its own.
Treat it as part of your strategy, not the whole thing. If you stay disciplined and wait for clean setups, the hammer candlestick pattern can be a valuable tool in your playbook.
FAQs
Is a hammer trading pattern bullish or bearish?
A hammer candlestick is a bullish reversal pattern that forms after a downtrend.
What is the hammer candle trading strategy?
It involves entering a buy trade after a hammer candlestick pattern forms at support, confirmed by a bullish candle afterward.
Can a bullish hammer be red?
Yes, but a green hammer is stronger. Note that both are valid if the setup is clean.
What is the difference between a pin bar and a hammer?
All hammer candles are pin bars, but not all pin bars are hammers. Pin bars can appear in any trend. Hammer candlestick patterns appear only after a downtrend.
What is the psychology behind the hammer candlestick pattern?
It shows that sellers lost control and buyers pushed the price back up, rejecting lower prices.


