As a trader for the past 6 years, let’s get this straight: You can trade profitably with numerous different methods. I personally use various techniques and indicators for trading both CFD and binary options. In this article, I’m going to discuss one of the best momentum oscillators available, the Chande Momentum Oscillator. I will also present my personal binary options trading strategy using the CMO indicator.
First, I’ll answer this question: “What is Chande Momentum Oscillator?”. After introducing the CMO indicator and showing you how it’s calculated, I’ll move on to guide you on how you can apply this indicator to your chart. I will also present the best Chande Momentum Oscillator settings based on my own experience. Finally, I’ll reveal my personal Chande Momentum Oscillator strategy for binary options trading and present some tips for using the CMO indicator correctly. So, bear with me to the end of this article if you want to add an additional tool to your trading arsenal.
• The Chande Momentum Oscillator (CMO) is a momentum indicator that helps traders measure price momentum and identify overbought/oversold conditions.
• The CMO formula calculates the difference between the sum of recent high closes and low closes, divided by their total sum, multiplied by 100.
• Traders can use the CMO indicator on TradingView and IQ Option by selecting it from the indicators menu and adjusting its settings for optimal performance.
• The best CMO strategy involves identifying the trend, waiting for price action to confirm reversals, and using a zero threshold breakout for trade entries.
• The CMO vs RSI comparison shows that both indicators function similarly, but the CMO allows for more flexible overbought/oversold threshold customization.
• Traders should combine the CMO with other indicators (e.g., moving averages, support/resistance) for confirmation rather than using it alone.
• Always backtest and practice with demo accounts before using the CMO indicator strategy in live trading to avoid unnecessary risks.
• Setting dynamic exit points with the CMO allows traders to ride trends longer rather than relying on fixed SL/TP orders.
What Is Chande Momentum Oscillator (CMO)?
As the name suggests, the CMO indicator is a momentum oscillator developed by Tushar Chande. If you are already familiar with momentum, understanding the CMO won’t be a problem. If not, let me provide a brief explanation.
Imagine the price of an asset as a car. The rate at which the car moves is called the car’s speed. The same concept is true for price. The rate at which the price of an asset changes is called momentum. Also, when a car has speed in one direction, it is likely to continue moving in the same direction. Unless, of course, you hit on the break or reverse. We also assume the price will continue its move in the same direction as it has been. So, when momentum is bullish (bearish), the price will likely move higher (lower) again.
Now, there are some momentum indicators that visualize the market momentum for you and are usually called oscillators. The Chande indicator is among the best of these. The CMO shows you whether the momentum is bullish or bearish and whether the price is in an overbought or oversold situation.
When the price is overbought (oversold), it is likely to reverse lower (higher). Just like a car that is going very fast and is likely to crash. So, you can use the CMO to identify whether the trend will continue and when it is likely to reverse. As a result, it is a very useful tool for both trend and reversal traders.
Read More: What Is the Flag Pattern and How Does it Work?
The Chande Momentum Oscillator Formula
Now, let’s see how the CMO indicator is calculated. The Chande Momentum Oscillator formula is as follows:
CMO = sH – sLsH + sL100
Where:
- sH = The summation of high closing prices over the given period
- sL = The summation of high closing prices over the given period
So, the CMO indicator works with the candle closes in price highs and lows. The period that you choose will also largely affect the indicator, as it will determine how much of the recent range it will consider for calculating the CMO. As you can see, the Chande indicator’s formula is also very easy to code if you prefer automated trading using trading bots or like to plot the indicator yourself.
Clearly, set higher periods, and the CMO will look further back to produce the oscillator values. On the other hand, lower values will cause the CMO to look at the most recent price action.
How to Apply the CMO Indicator to Your Chart?
Well, you have a general overview of the Chande now. So, I will show you how you can apply the CMO indicator to your chart on both TradingView and IQ Option (for binary options traders).
Chande Momentum Oscillator on TradingView
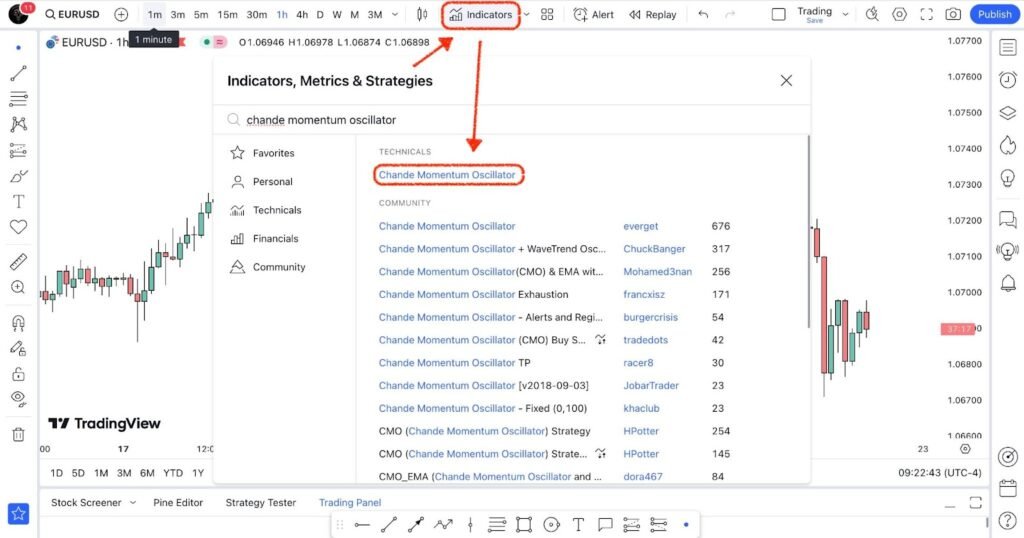
To apply the CMO indicator to your TradingView chart, you should first navigate to the indicators section at the top of the screen. Click on it and search for the “Chande Momentum Oscillator.” Choose the one by TradingView itself, which will be at the top of the list.
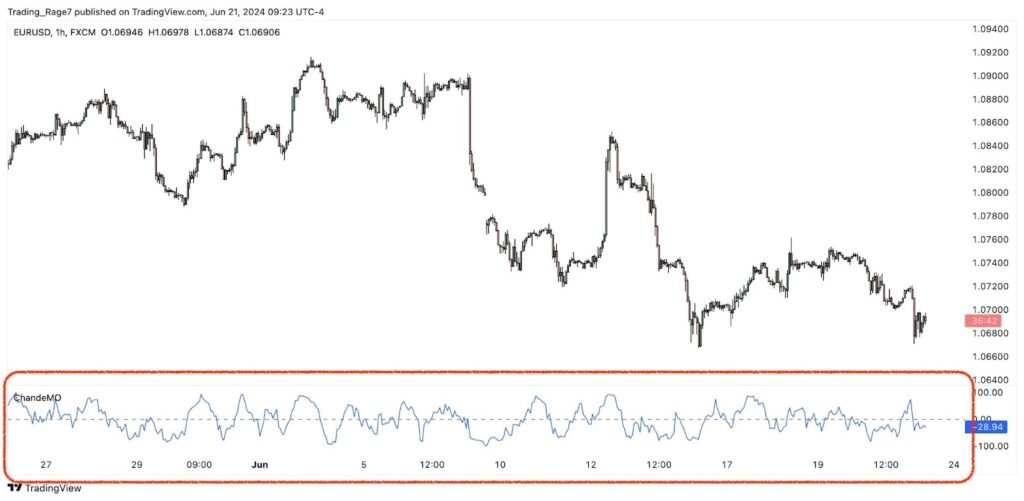
The CMO will then be applied in a pane at the bottom of the chart. It will look like the image below.
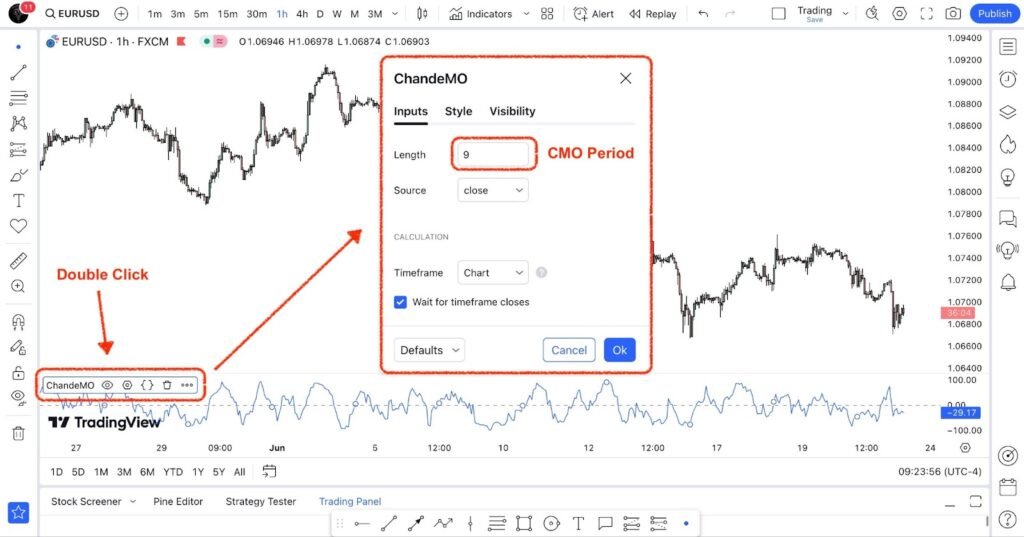
You can double-click on the CMO name on the bottom left side, and a panel will open up. You will be able to change the Chande period or customize the indicator style as you wish.
Chande Momentum Oscillator on IQ Option
For binary options traders interested in the Chande Momentum Oscillator, using the IQ Option trading platform is the best choice. To apply the CMO indicator to your IQ Option chart, you should first click on the “Indicators” button on the bottom left, choose “Momentum”, and then select the “Chande Momentum Oscillator.”
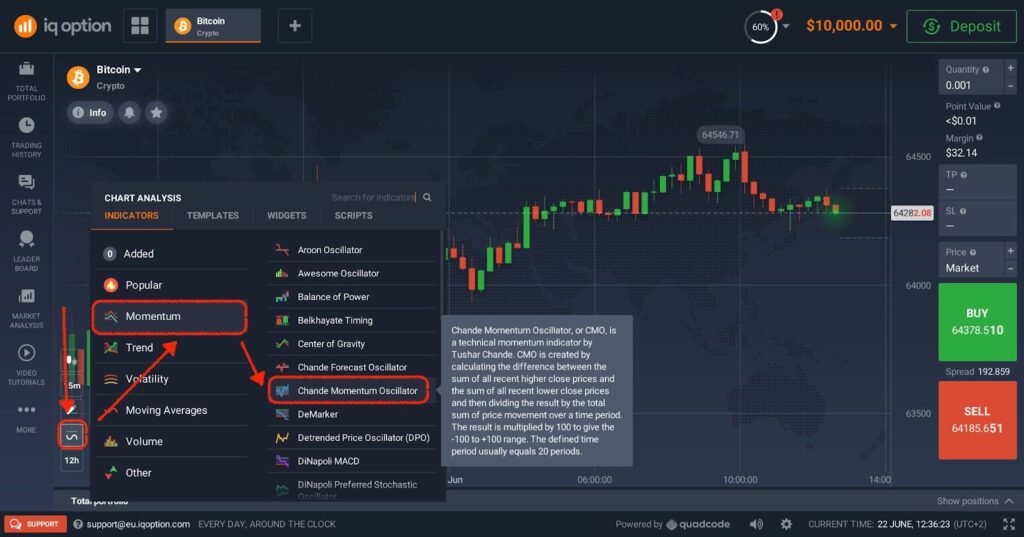
Then, a screen will pop up which will allow you to modify the Chande Momentum Oscillator settings. You can select the period and the overbought and oversold threshold values. When you’re done, click on apply.
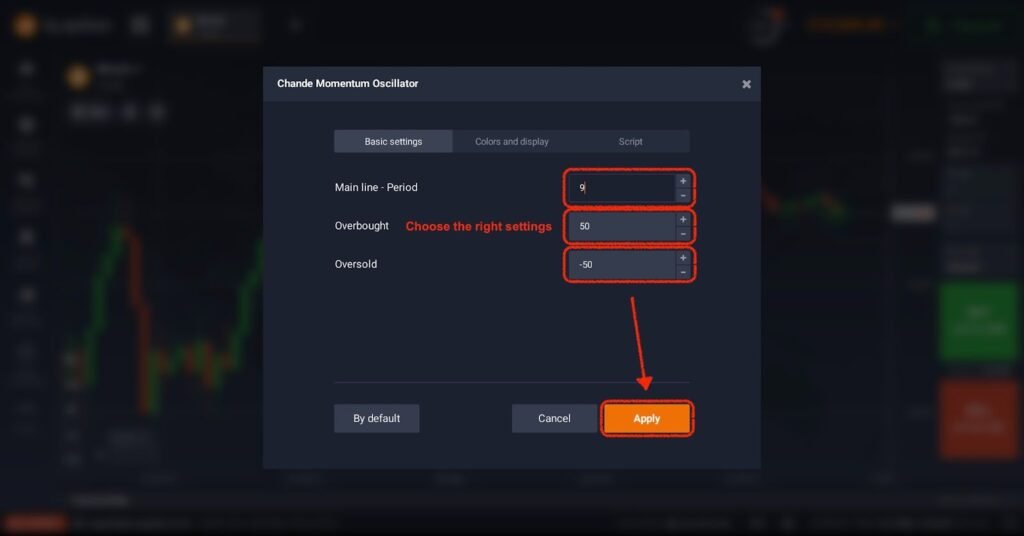
Finally, you will see the CMO indicator at the bottom of the chart.
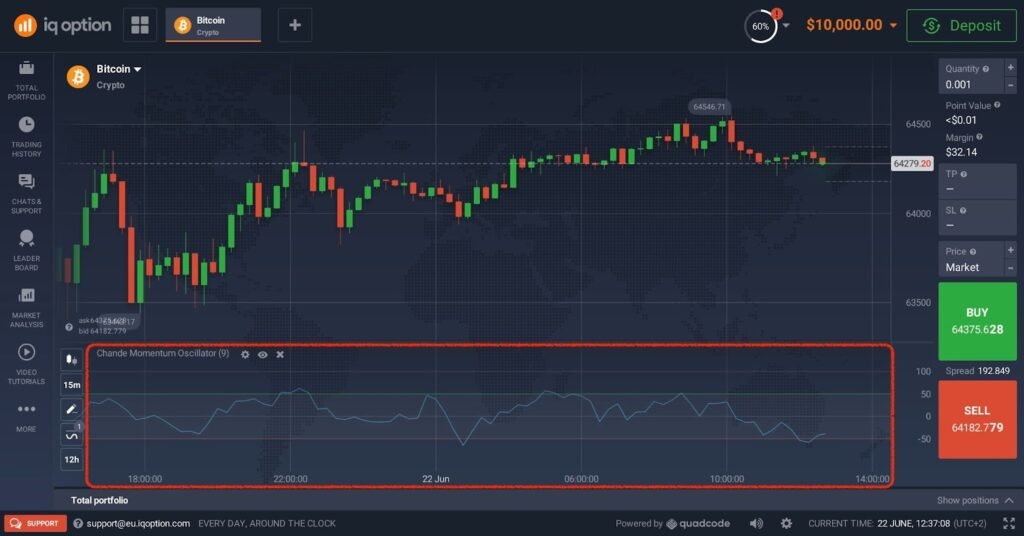
If used correctly and paired with additional trend indicators like the Supertrend indicator and the Fractal Chaos Bands, the CMO can be one of the best indicators for binary options trading.
How to Use Chande Momentum Oscillator?
In this section, I’ll introduce my own Chande Momentum Oscillator strategy. The first step is to set the period of the CMO indicator to 20. This way, the CMO scans the last 20 candles to plot. It gives a smoother and clearer picture of momentum compared to lower periods.
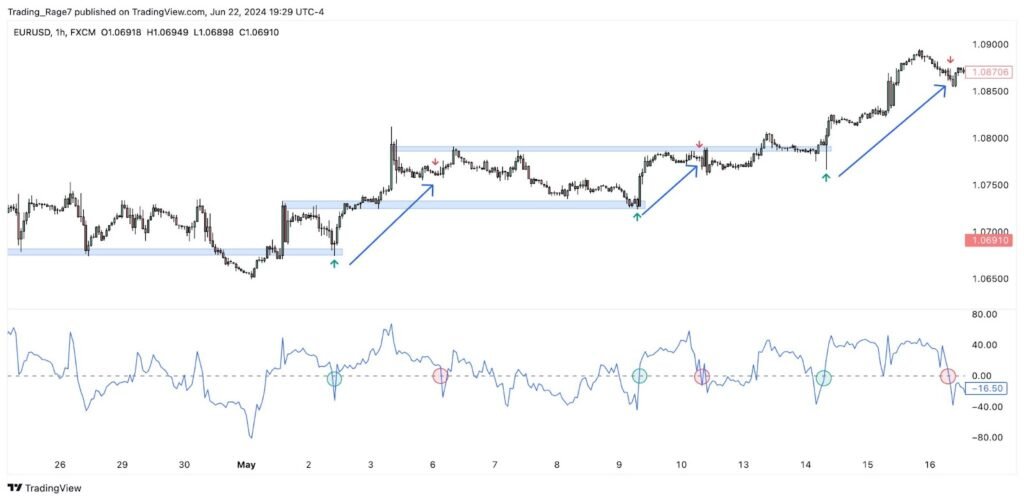
Next, you should identify the overall trend on your chart. Keep away from consolidating markets. For example, the trend is bullish on the chart below. I will then draw the most significant and recent support.
When the price reaches these levels and rebounds higher, and the CMO also breaks above the zero threshold simultaneously, I’ll execute a buy order. According to my CMO indicator strategy, I will keep the position open until the Chande drops back below 50%. Take a look at the image below for a bullish example:
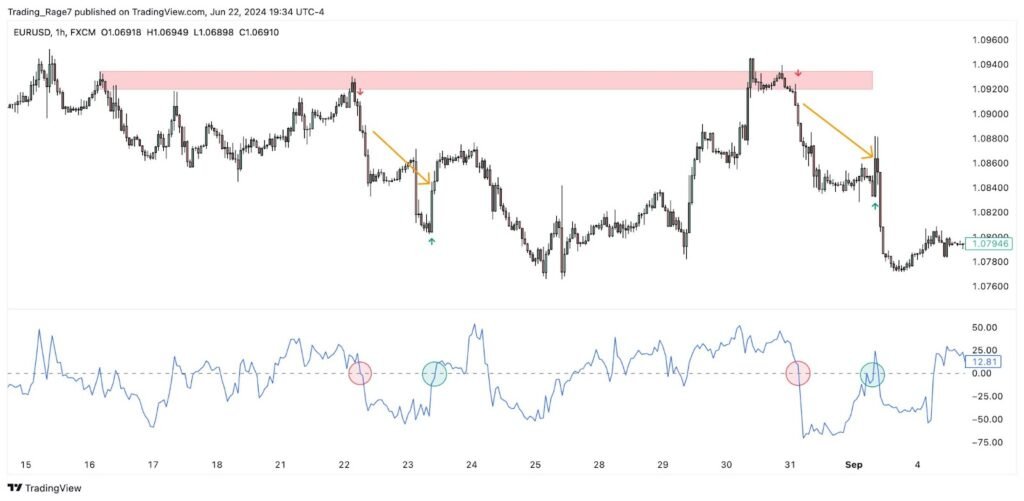
The process is almost the same for bearish trends. I’ll draw the recent resistance zones. If the price gets rejected by them and the CMO also drops below the zero threshold, I’ll execute a sell order. The exit will also be when the Chande rises back above zero. Here is a bearish example:
You can also put a stop loss below recent lows and a take profit order at nearby resistance levels. Overall, this is the Chande Momentum Oscillator strategy I personally use. However, if you want to pair the CMO with a simple trend indicator, I’d suggest checking out the Donchian Channels indicator.
Chande Momentum Oscillator vs RSI
The CMO and the Relative Strength Index are both oscillators. They practically function the same as they identify the market momentum and the shifts it experiences. The primary difference between the CMO and RSI is their formula.
You can also implement overbought and oversold signals like those of the RSI with the Chande Momentum Oscillator. For instance, you can set the +50 and -50 levels as overbought and oversold thresholds, respectively. So, when the price either rises above +50 or falls below -50, you can expect a reversal.
If you’re looking for other oscillators, I suggest checking out this guide on the Accelerator Oscillator by Bill Williams.
Pro Tips For Using the CMO Indicator Strategy
Finally, let’s take a look at a few tips and tricks I’ve learned through the years. You can apply them to your trading to make the most of your CMO indicator strategy.
- Don’t Use the CMO Alone: The CMO indicator is an oscillator. We don’t typically use momentum oscillators alone. Whether using a moving average or even support and resistance levels, these tools can complement your Chande momentum Oscillator strategy.
- Set the right period: Make sure to set the period of the CMO according to your trading style. For instance, if you are a scalper and execute several small trades, lower periods are better for you.
- Don’t trade the range: While many believe oscillators are suitable for range trading, I don’t believe so. Trading with the trend significantly boosts your chances of success. Check out the best times to trade binary options to avoid choppy market conditions.
- Practice before live trading: Use demo accounts or backtesting software tools to practice and optimize your CMO indicator strategy before applying it to the live market.
- Set dynamic exit points: The Chande indicator allows you to exit positions when the momentum shifts. While you can also set fixed SL and TP orders, I prefer setting them dynamically because it allows you to capitalize on large, occasional moves.
Conclusion
The Chande Momentum Oscillator might not be as popular as the RSI. Yet, it can be as useful or even more so. The CMO indicator allows you to identify momentum quantitatively. This can be very helpful in your trading, no matter the instrument. Both binary options traders and other types of traders can use the CMO indicator strategy to gain profits consistently.
In this article, I’ve also presented my personal Chande Momentum Oscillator strategy. Feel free to modify the parameters to personalize the strategy according to your preferences. Yet, keep in mind that trading any new strategy can be very risky, so you should practice before risking real money and not expect supernatural gains from any strategy, including the CMO.
If you’re interested in more advanced methods, check out this full guide on ICT Fair Value Gaps.

