When price action gets squeezed between two lines that move closer together, forming a tighter and tighter range, traders call this a wedge trading pattern. It’s not just a random shape on the chart: wedges often come right before strong breakouts or signal that a bigger trend is still in play.
Spotting a wedge pattern at first can feel a bit tricky. Are the lines really coming together, or is it just market noise messing with you? Don’t worry, that confusion is totally normal when you’re starting out with technical analysis.
By the time you finish this article, you’ll not only understand what wedges are, but you’ll also know how to recognize both rising and falling ones, and feel confident enough to see them as legit trading opportunities.
- A wedge trading pattern forms when price action gets squeezed between two lines that move closer together, often signaling strong breakouts or trend continuation.
- Wedge patterns come in two main types: rising wedges and falling wedges.
- A rising wedge, also called an ascending wedge, slopes upward with support rising faster than resistance and usually signals bearish outcomes
- In an uptrend, a rising wedge often acts as a reversal pattern, while in a downtrend it usually signals continuation.
- A falling wedge, also called a descending wedge, slopes downward with resistance falling faster than support and typically signals bullish outcomes.
- In a downtrend, a falling wedge often hints at reversal, while in an uptrend it usually signals continuation.
Understanding the Wedge Pattern in Trading
In technical analysis, you’ll hear lots of pattern names, and each one has a story behind it. Think of candlestick patterns like Engulfing or Tweezers; they were named that way for a reason, not by accident. The same idea applies to price patterns like the wedge.
In everyday language, a wedge is simply a shape that’s wide on one side and narrow on the other, like a doorstop or a piece of cheese. It’s kinda the same in trading.
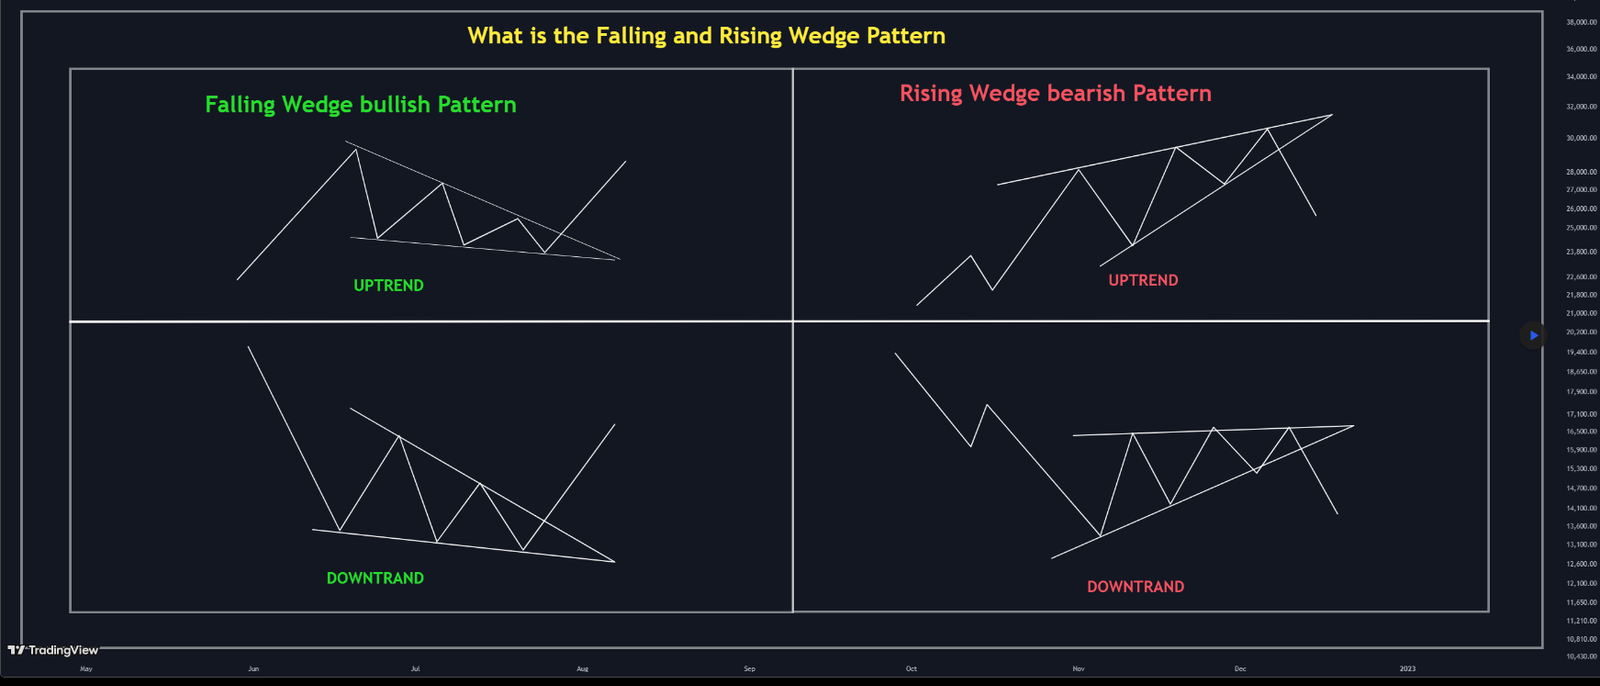
On a chart, the wedge pattern gets its name because price action often forms that shape. Draw one line across the highs and another across the lows, and those lines start to move closer together, creating a narrowing wedge. They come in two types: rising wedges and falling wedges. Depending on the current trend, they can act as either continuation patterns or reversal patterns. In the next section, I’ll explain each type and the idea behind them.
What Is a Rising Wedge? (Ascending Wedge)
A rising wedge, also called an ascending wedge, forms when you draw one line across the highs and another across the lows, and both lines slope upward. The key detail is that the line under the lows rises faster. That makes the two lines move closer together, creating a narrowing wedge that points up.
The look is clear: price rises inside a tightening channel, but momentum is fading. Psychologically, price keeps making higher highs and higher lows, which seems bullish at first. But the highs are rising more slowly than the lows, showing buyers are still active yet losing steam. Sellers step in earlier, which often sets up a move lower, either a reversal or a continuation of a bigger downtrend, depending on context. This is also known as a bearish wedge pattern, since it shows buyers starting to lose their strength.
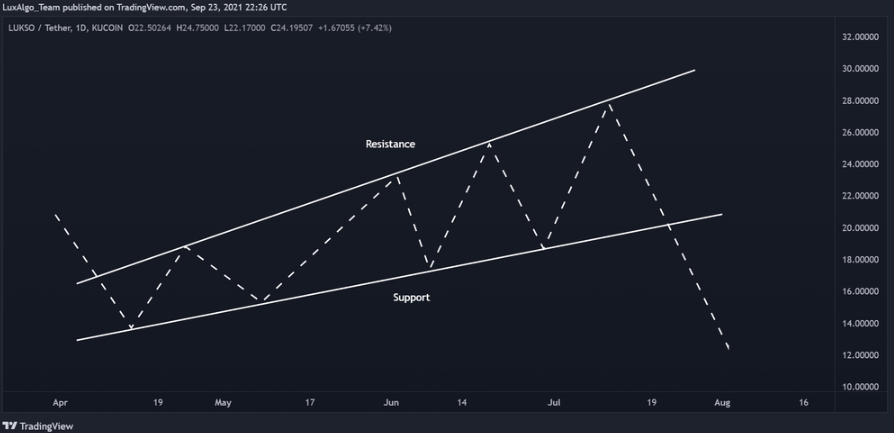
- In an uptrend, it is usually a bearish reversal pattern. As the upward move gets weaker, the wedge tightens, momentum slows, and most breakouts take form from the lower trendline, signaling a potential shift in the trend.
- In a downtrend, it often appears during a pullback. Price drifts upward inside the wedge, but the highs rise more slowly than the lows. That’s a sign the bounce is weak. When the pattern completes, the breakout usually takes form from the lower trendline, and the original downtrend resumes.
What Is a Falling Wedge? (Descending Wedge)
On the other side, there’s the falling wedge pattern (also called a descending wedge). Picture this: you draw one line across the highs and another across the lows, both lines slope downward, but the line on top drops faster. That makes the lines move closer together, creating a wedge shape that points down.
What this really shows is price moving lower inside a narrowing channel, but with less and less strength behind it. At first glance, it seems bearish because both highs and lows keep moving down. But since the highs fall quicker than the lows, it signals that sellers are losing momentum and buyers are stepping in sooner each time. This is also known as a bullish wedge pattern, since it shows the sellers starting to lose their strength.
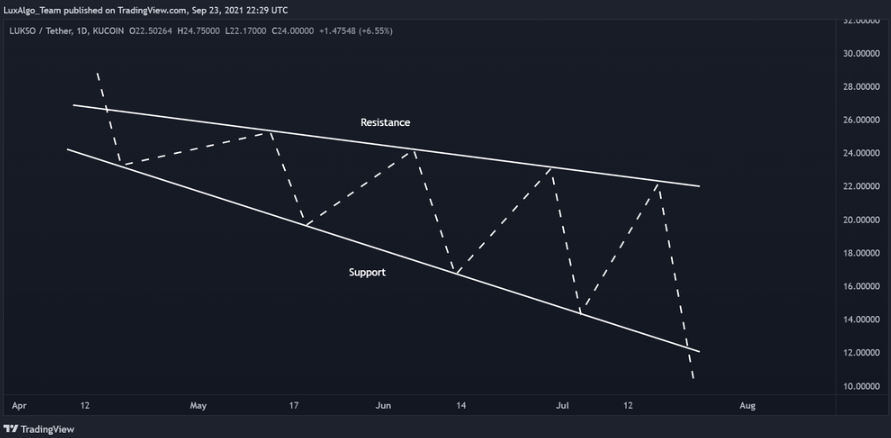
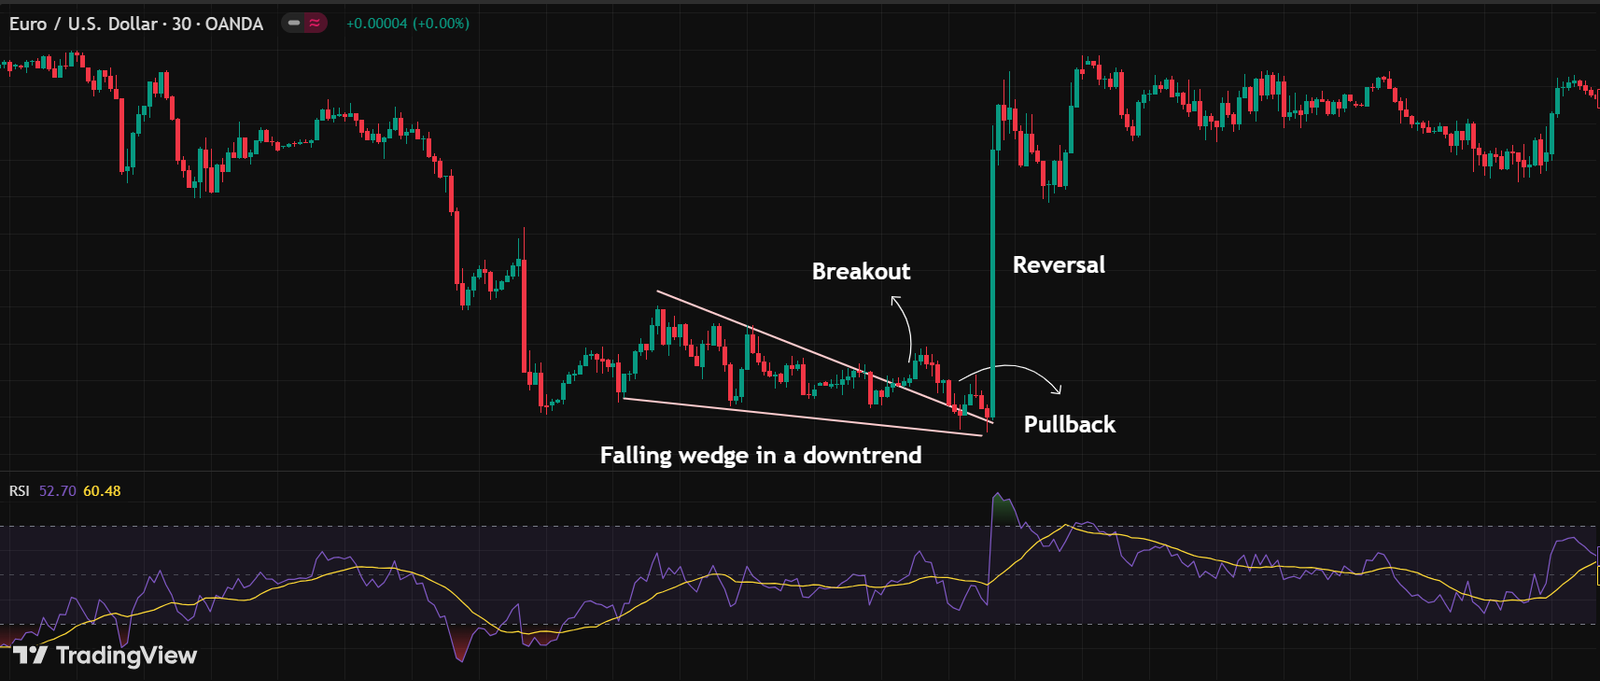
- In a downtrend, it often means the trend might reverse. The downward push weakens, the wedge tightens, and more often than not, the breakout happens from the upper trendline.
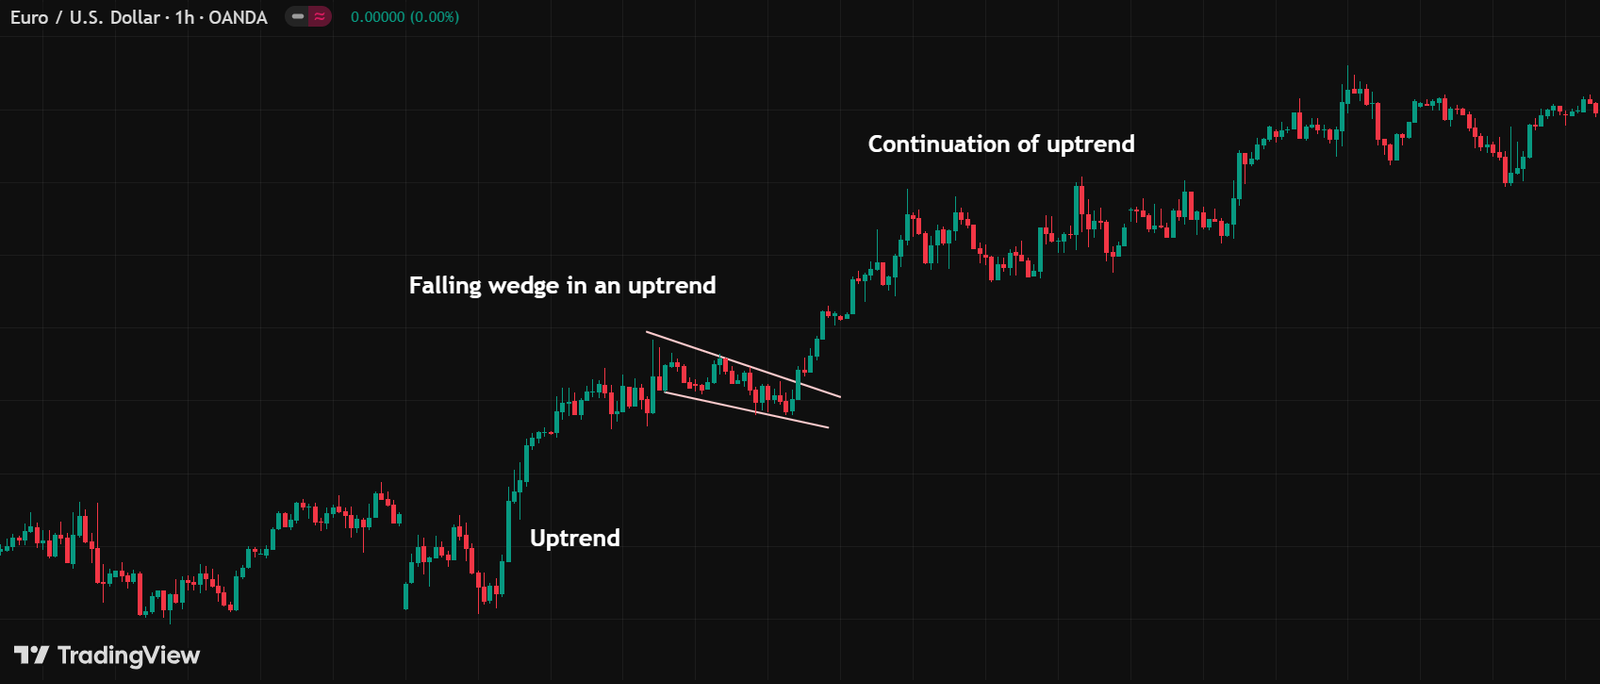
- In an uptrend, it usually shows up as a small pullback or correction. Price dips within the wedge, but since the drop is weak, the breakout is again usually upward, resuming the original uptrend.
Rising wedge vs. Falling wedge: What’s the Difference?
To get a clearer picture of wedge patterns, let’s look at the difference between rising and falling wedge trading patterns.
| Feature | Rising Wedge | Falling Wedge |
|---|---|---|
| Shape | Sloping upward with converging trendlines (both support & resistance rising, but support rises faster). | Sloping downward with converging trendlines (both support & resistance falling, but resistance falls faster). |
| Trend Context | It can appear in both uptrends and downtrends. | It can appear in both uptrends and downtrends. |
| Typical Implication | Reversal pattern in an uptrend, continuation pattern in a downtrend. | Continuation pattern in an uptrend, reversal pattern in a downtrend. |
| Breakout Direction | Usually breaks downward, below the support line. | Usually breaks upward, above the resistance line. |
Wedge Patterns Characteristics
A wedge pattern, whether rising or falling, can show up in both an uptrend and a downtrend. To spot it easily on a chart, here are the key things to look for:
- Trendlines: A wedge pattern forms when you draw two lines: one across the highs and one across the lows that gradually move closer together.
- Slope: In a rising wedge, both lines tilt upward (but the lows rise faster than the highs). In a falling wedge, both lines tilt downward (with the highs dropping faster than the lows).
- Shape: As the lines squeeze in, they form that classic wedge look: pointing up for a rising wedge and down for a falling wedge.
- Volume & Momentum: In both cases, trading volume usually fades as the wedge takes shape, which is a sign that momentum is slowing down. Pretty much the market is saying, “I’m running out of fuel.”
Trading Rising Wedge Patterns (Real Examples)
So far, we’ve covered what a wedge is and what rising and falling wedges can tell us on a price chart. Now, let’s move from theory to practice and look at a real example of trading a rising wedge pattern.
Rising Wedge in an Uptrend
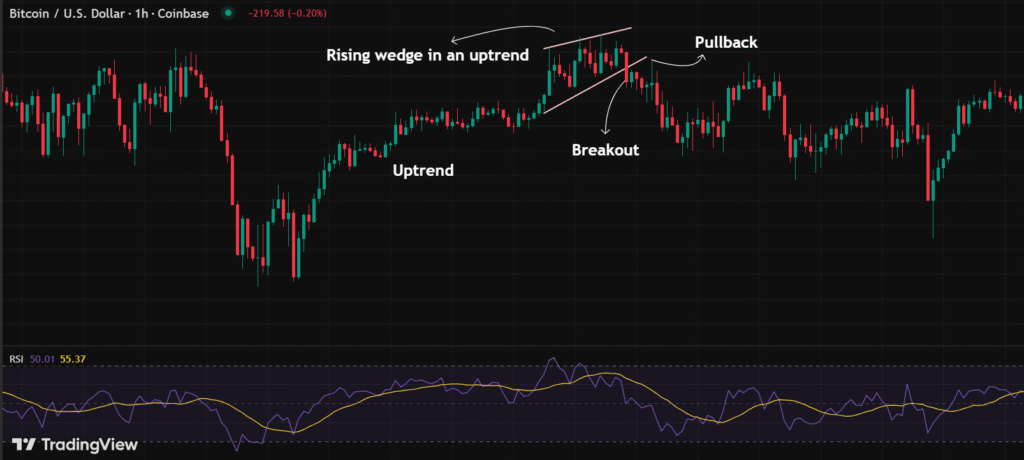
In the chart below, the price was moving in an uptrend until it hit a key resistance level and couldn’t push higher. Toward the end of that uptrend, the price formed a rising wedge pattern, with two trendlines sloping upward and closing in on each other.
As we explained earlier, a rising or ascending wedge in an uptrend usually signals a reversal. Here, the price broke through the lower trendline (which acted as support), hinting at a shift from bullish to bearish. To make the signal stronger, the market also formed a small pullback after the breakout, confirming the bearish move. On top of that, the RSI indicator showed a bearish divergence, a nice extra confirmation that sellers were stepping in.
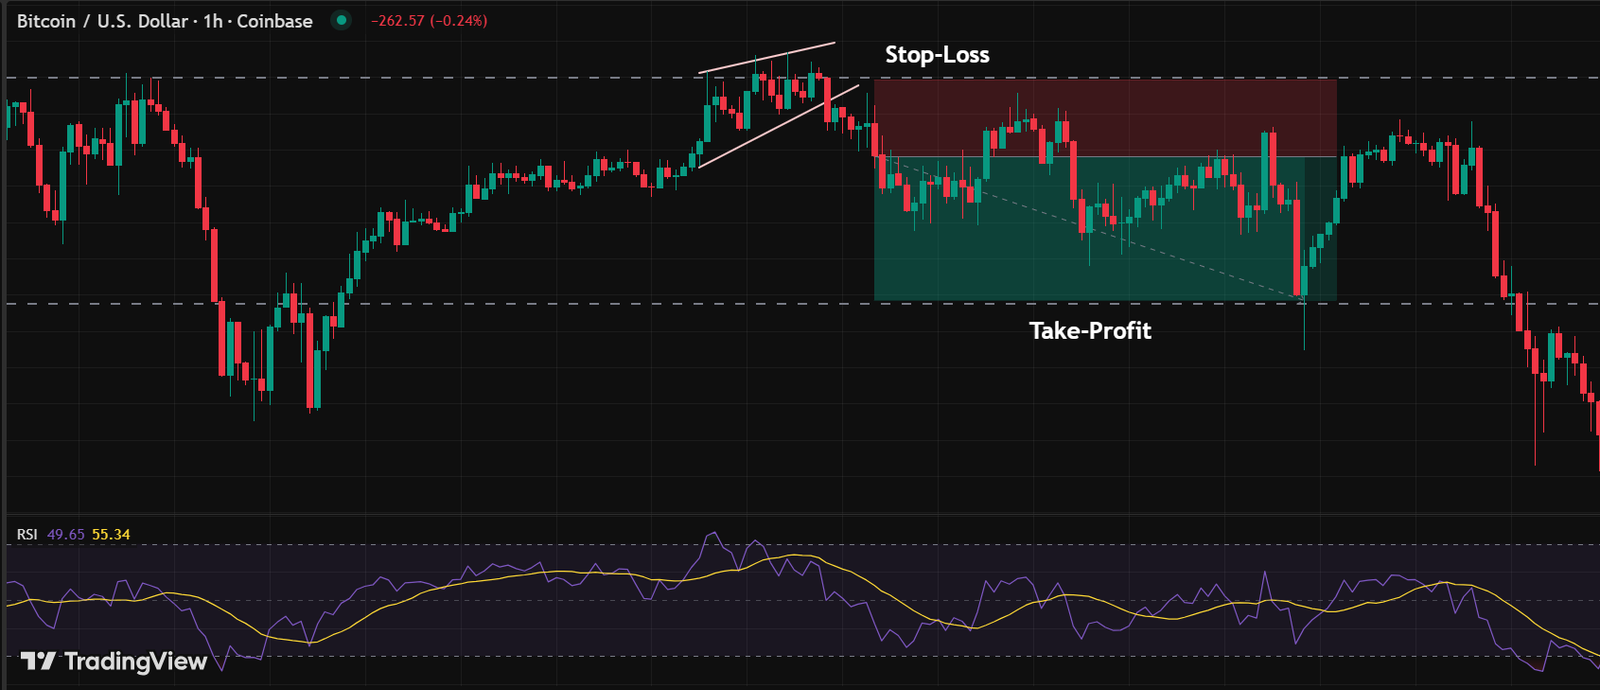
Now, let’s say this was happening live and you were ready to trade it. Here’s how you could set it up:
- Entry: Take a short position once the price pulls back and a bearish candle closes after the breakout.
- Stop-loss: Place it just above the lower trendline.
- Take-profit: Aim for levels near the previous support zone or around recent swing lows.
Rising Wedge in a Downtrend
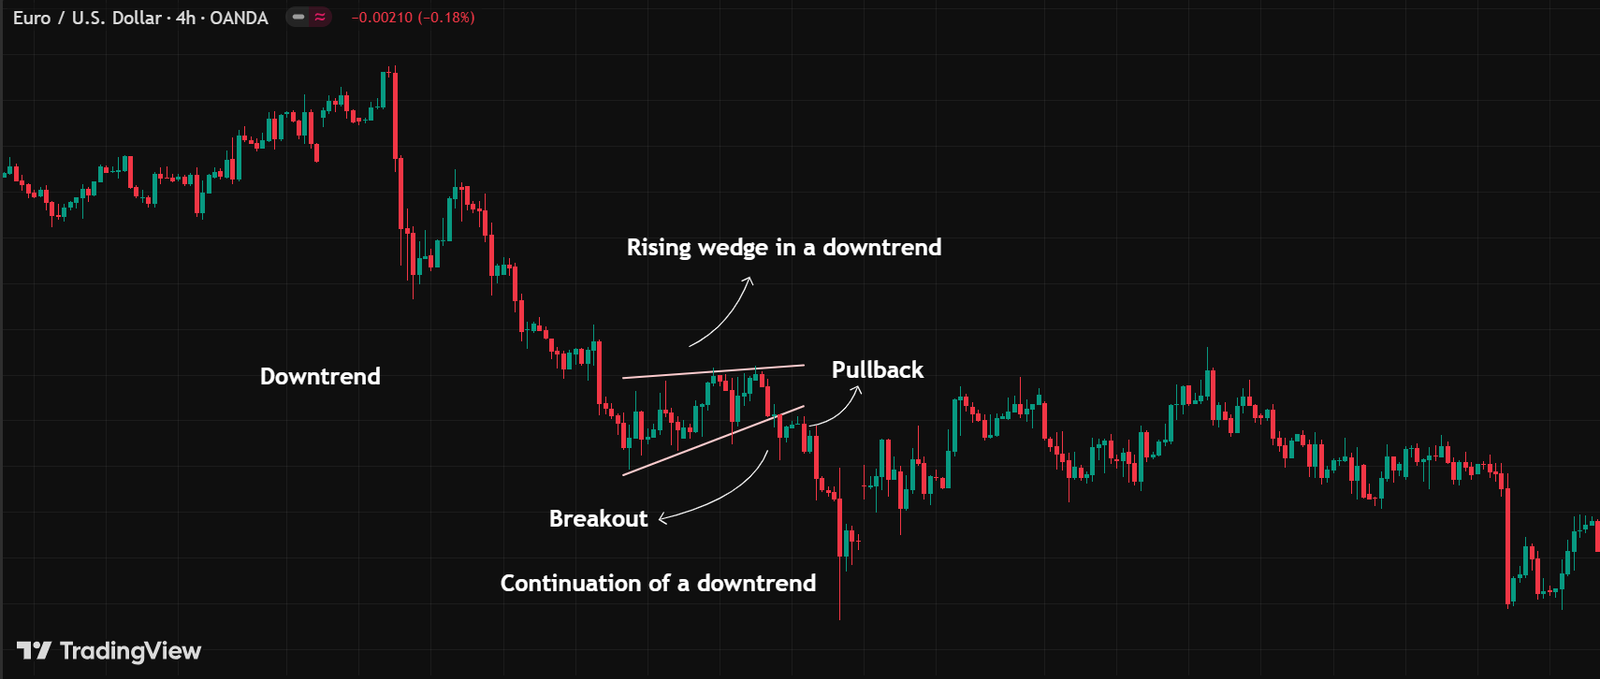
As mentioned earlier, a falling or descending wedge pattern can also form during a downtrend. In the pattern shown below, the price moved upward for a bit, which at first glance looked like a recovery. But inside the wedge, the highs were rising more slowly than the lows. This showed that buyers were trying to fight back, but each rally was weaker, and sellers were jumping in earlier every time. You can see that the price finally broke below the lower trend line (support) and then pulled back. This pullback confirms the falling wedge pattern.
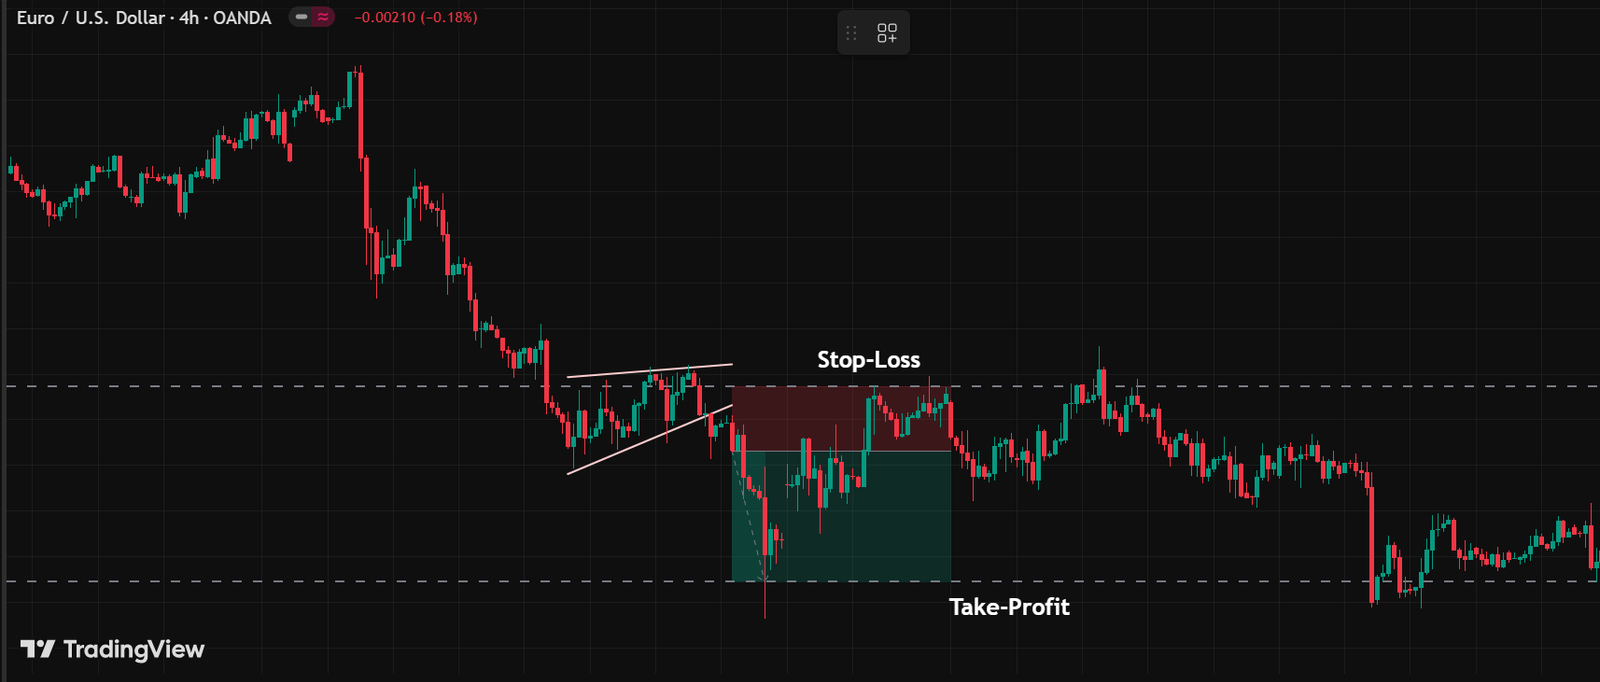
If you wanted to trade this setup with a short position, here’s one way to do it:
- Entry: Open a short position when the price pulls back and a red engulfing candle closes.
- Stop-loss: Place it just above the lower trendline.
- Take-profit: Set it near the previous support levels or recent swing lows (though in this image, the earlier support zone isn’t shown).
Trading Falling Wedge Patterns (Real Examples)
To get a clearer idea of how wedge patterns work in real life, let’s check out two more examples. This time, we’ll focus on the falling wedge pattern and what it means for traders.
Falling Wedge in a Downtrend
In the chart below, the price was moving downward until it hit a resistance level and formed a falling wedge. As you can see in the drawing, the price then broke out above the trend line and made a pullback. Right after that, a strong green candle appeared, showing a clear change in direction. At the same time, the RSI indicator showed a bullish divergence, which confirmed the trend reversal.
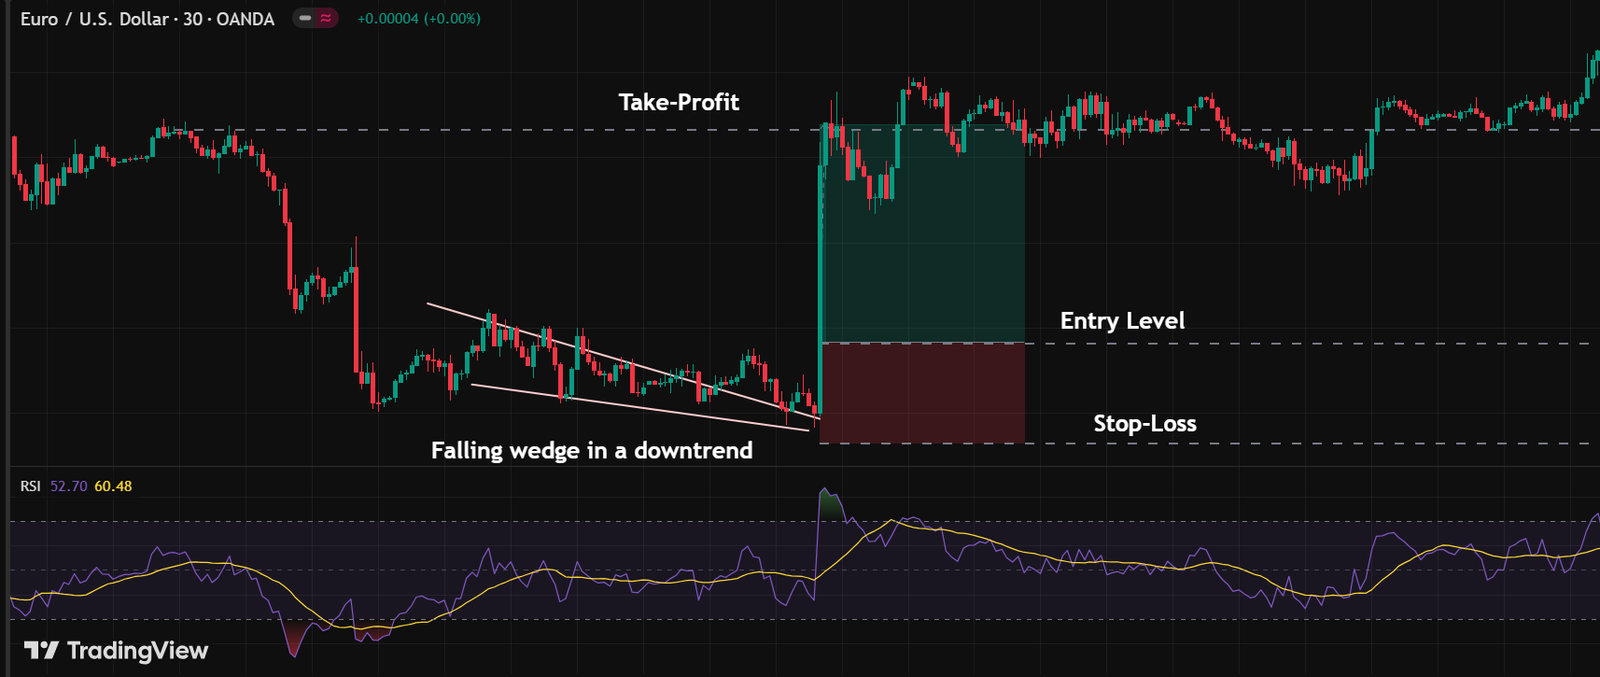
Based on this setup, here’s how you could manage your trade:
- Enter a long position once the green candle is formed.
- Set your take-profit order near the previous swing highs.
- Place your stop-loss just below the wedge’s support line.
Falling Wedge in an Uptrend
Now, let’s flip the script and see what happens when a falling trading wedge forms during an uptrend.
As mentioned earlier, a falling wedge in an uptrend usually signals a short pause before the price keeps moving upward, at it really shown in the picture below.
Wedge Patterns Pros and Cons
The more you know about the pros and cons of wedge trading patterns, the better you can shape your trading strategy. Here’s a quick look at both the good and not-so-good sides of this chart pattern.
| Pros | Cons |
|---|---|
| Work across markets | Subjective drawing, traders may draw lines differently |
| Defined structure | False breakouts |
| Can signal early entry before big moves | It can take a long time to form, testing patience |
| Show momentum weakening (buyer/seller exhaustion) | Less reliable in choppy or low-liquidity markets |
What to Consider when Trading the Wedge Chart Patterns
Just like trading other chart or candlestick patterns, there are always a few tips that can help you get better results. Here are some key points to keep in mind when trading wedge trading patterns:
1. Understand the Wedge Pattern Characteristics
Besides learning what wedge chart patterns look like, it’s important to understand how the market usually behaves when they form. This gives you clues about momentum, trader sentiment, and the potential breakout direction.
2. Wait for Confirmations
As with candlestick trading, it’s always better to wait for confirmation before jumping in. You can use technical indicators, candlesticks, or even other chart patterns, such as symmetrical triangles, cup and handle patterns, or double tops and bottoms, to double-check your entry.
3. Use Stop-Loss and Take-Profit Orders
A solid strategy always includes stop-loss and take-profit orders. Whether you’re trading a wedge chart pattern or other patterns, these tools help protect your profits and keep your entries and exits more precise.
4. Backtest Your Strategy
Every strategy needs practice. Start by testing wedge setups on a demo account. Once you refine your approach and feel confident, you can move on to live trading.
5. Have a Risk Management Plan
Set clear rules for position sizes, stop-losses, and profit-taking. This helps you avoid emotional decisions and keeps you on the winning side more often than not.
Conclusion
Wedge patterns can signal both reversals and continuations; it all depends on the ongoing trend. A rising wedge (sometimes called a bearish wedge pattern) in an uptrend often hints at a reversal, while in a downtrend it suggests the trend might continue. On the flip side, a falling wedge (sometimes called a bullish wedge) in an uptrend often acts as a continuation signal, but when it shows up in a downtrend, it can warn of a possible reversal.
At the CrypOption Hub blog, we regularly cover the basics of technical analysis. If this article helped you out, drop your thoughts in the comments. We’d love to hear from you!


