The first time I used a trading platform, I got super confused. There were so many indicators on the screen, and even worse, lots of strange, complicated words. I only knew one or two of them, and I thought learning the rest would be really hard.
If you feel the same way, don’t worry. You’re not the only one, and it’s totally normal to feel a bit lost at first. In this article, I’m going to help you understand one of those tools with a weird name, but it actually works in a very simple way: the ADX indicator. By the end of this article, you’ll know what it is and how to use it on different trading platforms.
Let’s get started and make things easy to understand.
- The ADX (Average Directional Index) is a tool that shows how strong a trend is, but it doesn’t say if the trend is up or down.
- The ADX indicator is a part of a system called the Directional Movement Index (DMI), which also includes two other lines: +DI (for upward trends) and –DI (for downward trends).
- ADX values go from 0 to 100. The higher the number, the stronger the trend—no matter which direction the market is moving.
- The usual setting for ADX is 14 periods, and that works well for most traders.
What Is the ADX Indicator?
Trading in the financial markets isn’t always about guessing what’s going to happen next. What really matters is understanding what’s going on right now and then adjusting your plan as things move forward. We’ve also talked about this idea in other articles, like the Zig Zag indicator. If this concept sounds familiar to you, great! If not, no big deal. I’ll give you a quick reminder: Some indicators help us see how strong a trend is. The ADX Indicator, or Average Directional Index, is another tool built for that exact purpose.
It’s part of something called the Directional Movement System, or the DMI Indicator. On its own, the ADX tells you how strong the trend is. But when you use it alongside the DMI, you can also figure out what kind of trend you’re in. Are we going down? Or are we starting to climb?

Note: Just to clear things up, the ADX by itself is actually just a single line. But sometimes, you’ll see it paired with two extra lines, which are for the Directional Movement Index or DMI indicator. They show you the direction of a trend.
How Does the ADX Indicator Work?
Understanding how to read the ADX indicator is actually super simple. It gives you a value between 0 and 100. So, just by looking at the numbers, you can quickly understand how powerful the current trend is. Pretty handy!
| ADX Value | Trend Strength |
|---|---|
| 0–20 | Weak Trend or No Trend |
| 20–40 | Moderate Trend |
| 40–60 | Strong Trend |
| 60–100 | Very Strong Trend |
ADX Indicator Calculation and Formula
Now, let’s take a look at the ADX Indicator formula:
When you see the ADX indicator on a chart, all you need to do is learn how to read it. The calculation is done for you, and you see the results as a line.
This calculation shows the strength of a trend, but doesn’t specify the direction. If you want the trend’s direction, you would look at the +DI and -DI values, which are a part of the DMI indicator.
- The +DI (Plus Directional Indicator) tells you if the market is in an uptrend.
- The -DI (Minus Directional Indicator) tells you if the market is in a downtrend.
How to Read the ADX Indicator on TradingView
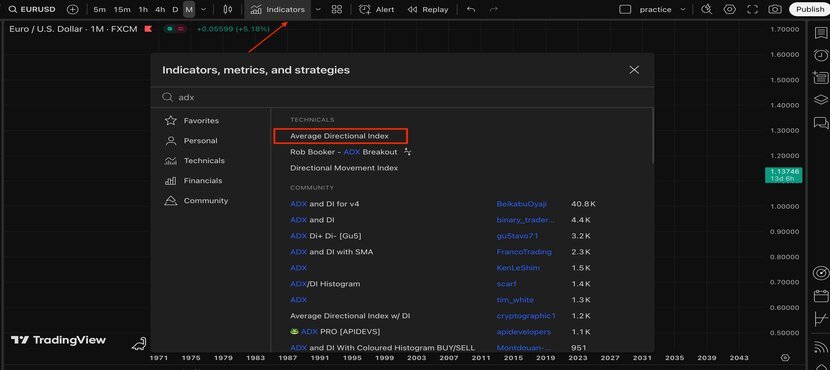
To read the ADX indicator on TradingView, it’s super easy. Just type “ADX” or “Average Directional Index” into the indicator search bar and add it to your chart.
Now, if you look at the image below, you’ll notice three clear areas I’ve marked. On the left side, you can see a strong bearish trend; as that trend gets stronger, the ADX line rises and goes above 40. As I mentioned earlier, when ADX goes above 40, the trend is strong. However, it doesn’t tell you which direction. It could be either a strong downtrend or a strong uptrend.
For example, on the right side of the chart, there’s another strong trend, this time bearish. Again, the ADX is high (above 40), showing strength, not direction.
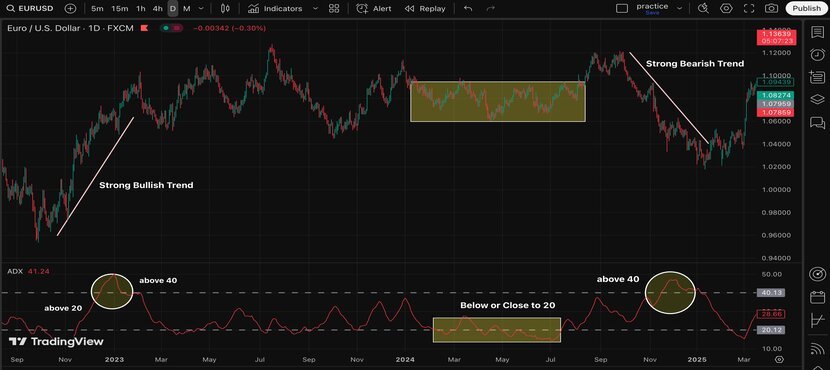
And what about when there’s no clear trend? That’s where the ADX is around 20 or lower. In that middle area of the chart, where things look kind of flat and uncertain, the ADX reflects that by staying low or close to 20.
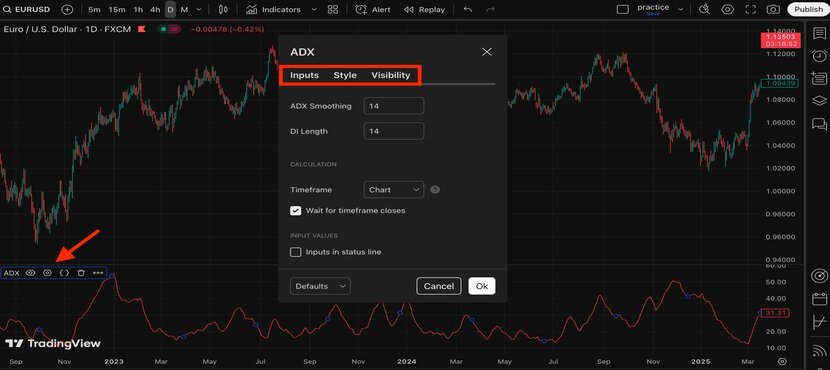
You can also change the setup from the settings section.
How to Use the ADX Indicator for Binary Options
You can use the ADX indicator on binary options platforms, too. If you’re not sure which broker is best for trading binary options, check out our article on one of the top platforms: Pocket Option Review. It might really help you make a better choice. I use it myself, and it works great.
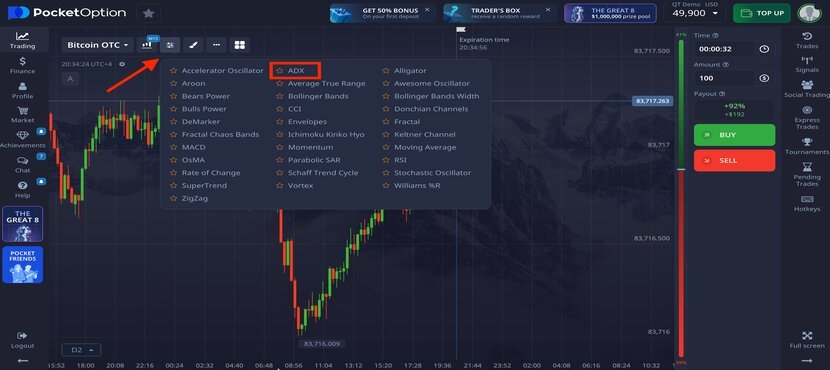
To use the ADX on Pocket Option, just open the list of indicators and select ADX.
On platforms like this, when you add the ADX, you’ll see three lines on your chart, not just one. One line is for the ADX indicator, and two others are for the +DI and –DI lines, as I discussed earlier.
In the image below:
- The orange line is the ADX (trend strength)
- The blue line is the +DI (uptrend signal)
- The yellow line is the –DI (downtrend signal)
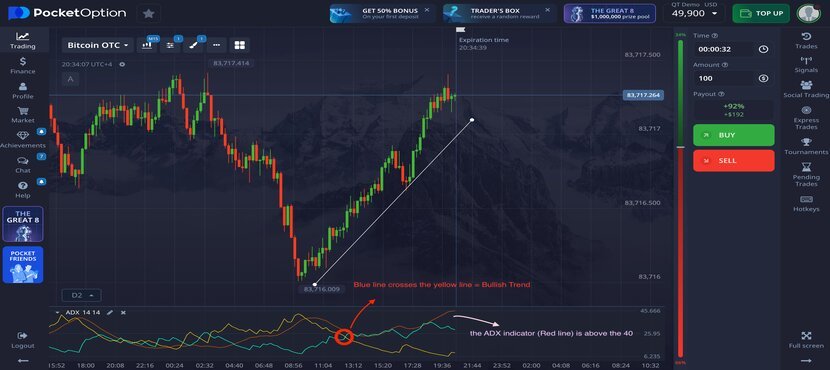
In this example:
- The ADX line is above 20, which means there’s a strong trend.
- The +DI line crosses above the –DI line, which means it’s a bullish trend (going up).
So, these three lines together show both the strength and the direction of the trend.
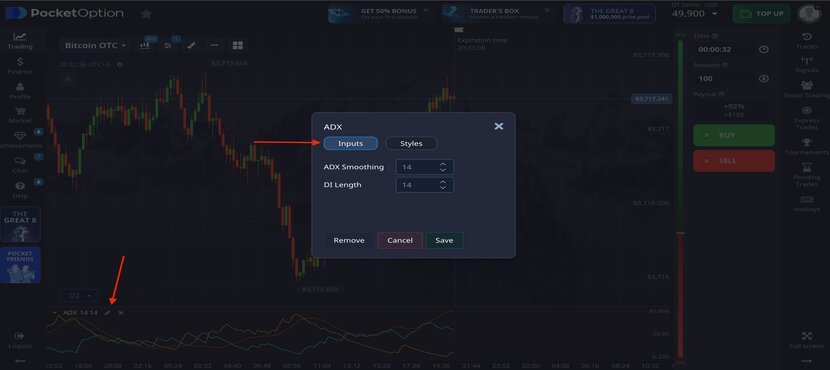
If you want, you can change the colors or other options by clicking the little pencil icon on the chart.
Read More: Best Time to Trade Binary Options
ADX Indicator Pros and Cons
So far, I’ve explained how the ADX indicator works and how to use it on different trading platforms. But just like many other tools, using ADX alone might not be enough.
You see, ADX is a lagging indicator. That means it shows how strong the trend is right now, but it doesn’t tell us what might happen next. That’s the downside.
But here’s the good news: One good option is the Accelerator Oscillator or other similar tools. While ADX shows trend strength, this oscillator helps you guess where the market might go next. Using them together can help you trade with more confidence.
| Pros | Cons |
|---|---|
| Helps identify trend strength, not direction | Doesn’t indicate trend direction by itself |
| Works well in combination with other indicators | May have a delay during trend changes |
| Helpful in confirming trend-based strategies | Can miss early opportunities in new trends |
ADX Indicator Settings
There are lots of different trading styles out there. For me, scalping feels a bit too risky. But at the same time, I don’t really have the patience for long-term position trading either.
You might be totally different. Maybe you like quick trades that last just a few minutes. That’s why I can’t say one ADX indicator setting works for everyone.
The ADX indicator usually has a default setting of 14 days. That’s pretty common and works fine for many traders. For example, if you are curious about how to use the ADX indicator for day trading, this setting can work for you, too.
But if you like faster signals and trade more aggressively, you can try changing it to something like 7 or 10, in shorter timeframes.
| Period | Explanation | Good for |
|---|---|---|
| 14 (Default) | Balanced between speed and reliability | Most traders use this (Day Traders) |
| 20–25 | Slower, more conservative signals | Catch only the strongest trends (Longer time frame) |
| 7–10 | More signals, but more noise | Scalpers |
Top Tips when Trading the ADX Indicator
The real power of trading comes from paying attention to the small details. Now that you understand how the ADX indicator works, here are a few extra tips that can really set you apart from the crowd.
- Sure, ADX is great for showing how strong a trend is, but for entry and exit points, it’s better to look at price action, like support and resistance levels or candlestick patterns. For instance, the hammer candlestick pattern could give perfect signals for longs, or Tweezer candles can show hints for both long and short positions. ADX only shows you if there is a trend, but not which direction or when to enter.
- Try not to use ADX alone when the market is moving sideways. It works best when the market is trending.
- Also, remember to use stop loss orders. Place them based on technical levels, not just a random number or percentage.
- You can also change the ADX period to match your trading style. The default is 14, but you can use a shorter period (like 7–10) for short-term trading or use a longer period (like 20–25) for swing or long-term trading.
- Above all, only risk 1–2% of your total capital per trade. This way, if you lose a few times in a row, you’ll still have enough to recover.
Conclusion
Well, that’s it for the ADX indicator: a helpful tool to understand how strong a trend is. If you’ve read this far, I hope you now have a clearer idea of how to read the ADX and use it on different trading platforms.
Don’t forget to stay tuned to Crypoptionhub! We’re always working on practical and easy-to-understand content to help you improve your trading skills.
And if you have any questions about the ADX strategy or anything we covered, feel free to drop a comment below. We’re here to help!


