There are thousands of trading signals out there, each telling you when to enter or exit a trade. But here’s the thing: have you ever stopped to wonder where those signals actually come from? If you’ve ever relied on them, you might have wished you could spot the trades on your own and close them successfully without depending on someone else.
That’s exactly what I’ll work on today. Instead of just handing you signals like everyone else, I want to show you how they’re created. Think of it as learning to fish, rather than being given a fish. Once you understand the process, you’ll have the confidence to trade by yourself.
To do so, in this article, I’ll walk you through a very practical and easy-to-use price chart pattern called the symmetrical triangle pattern. By the end, you’ll know how it works and how to trade it step by step.
Let’s get started!
- Symmetrical triangle patterns are formed when both the resistance line slopes downward and the support line slopes upward, shaping a triangle shape.
- This pattern is usually considered a continuation pattern, meaning the price often breaks in the direction of the prior trend.
- To spot a valid symmetrical triangle, there should be at least two touches on each trendline and declining trading volume.
- Confirmation signals, like pullbacks and candlestick patterns, increase the chances of a successful trade.
An Introduction to Symmetrical Triangle Patterns
In technical analysis, you’ve probably come across the term symmetrical triangle pattern. But maybe you’re not fully sure how it works or where it comes from. Don’t worry! That’s what we’re going to clear up today.
First, let’s zoom out a bit. A symmetrical triangle is one of the three main types of triangle patterns in technical analysis. The other two are the ascending triangle and the descending triangle. Each of these patterns has its own unique structure and usual market behavior.
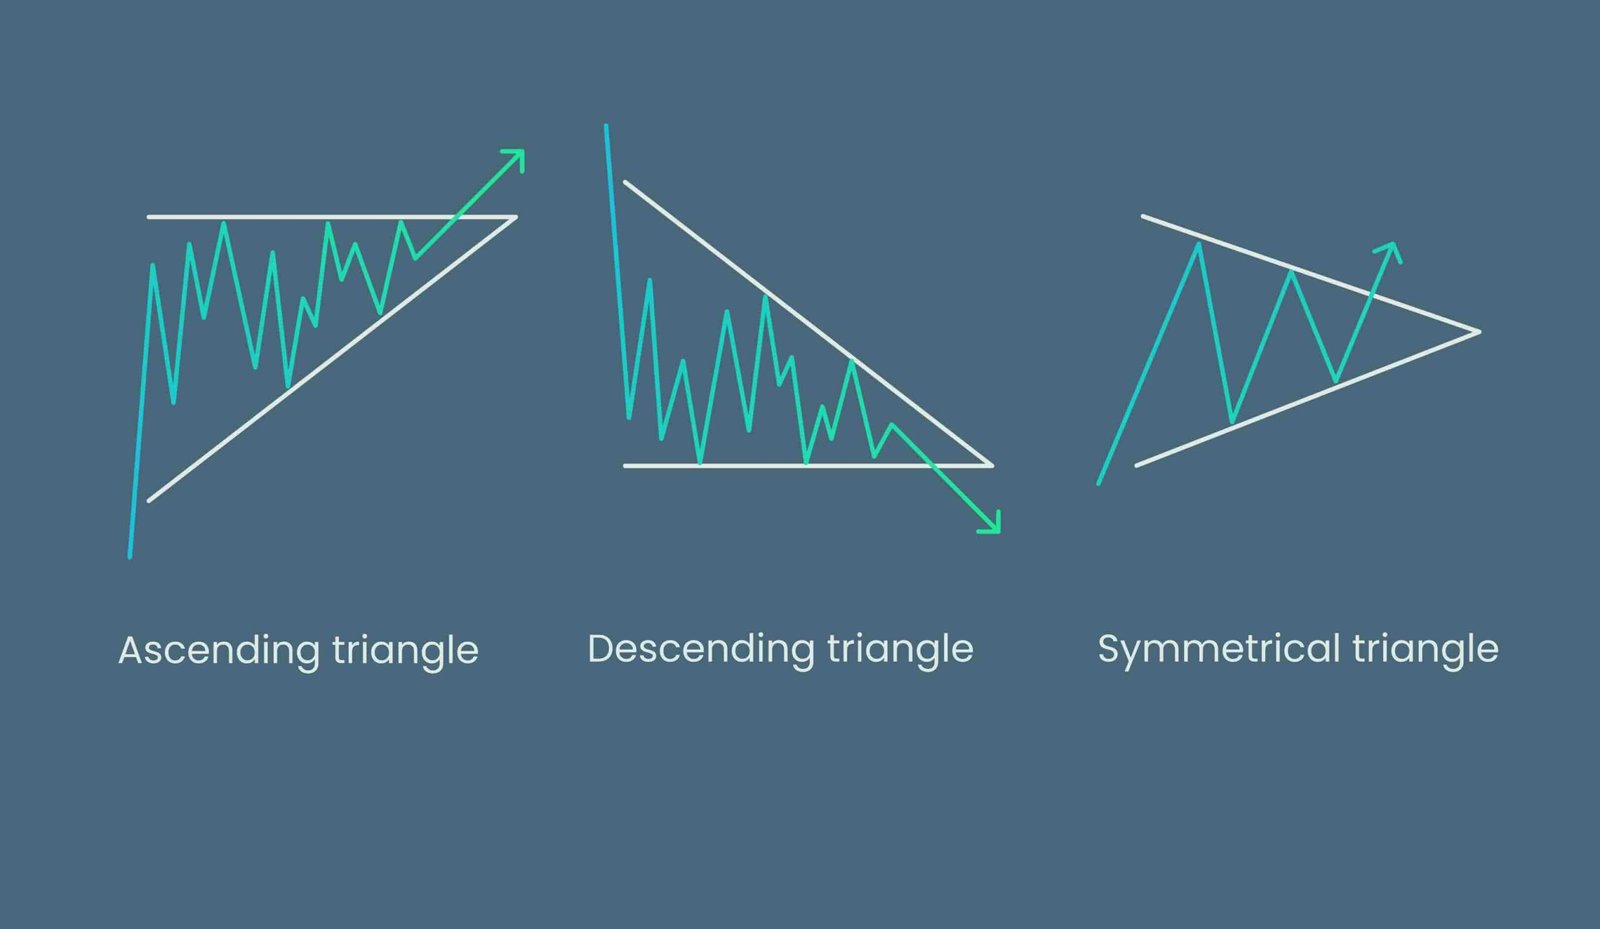
- Ascending triangle: This one has a flat resistance line on top and a rising support line below. It’s usually considered a bullish pattern.
- Descending triangle: Here, the support line is flat at the bottom, while the resistance line slopes downward. This setup is typically bearish.
- Symmetrical triangle: And then we have the symmetrical triangle, where both resistance and support lines slope toward each other. As the name suggests, this forms a clean, symmetrical triangle shape. It can be a bearish symmetrical triangle pattern or a bullish symmetrical triangle pattern.
What Is a Symmetrical Triangle Pattern?
The symmetrical triangle pattern involves two trendlines: The upper line, called resistance, slopes downward, with each peak (or high) lower than the last, and the lower line, called support, slopes upward, with each trough (or low) higher than the one before. Together, these lines squeeze the price into a tighter range, shaping the triangle.
Now, the big question most people ask when learning about this pattern is: Is it a continuation or a reversal?
Traders usually think of a symmetrical triangle pattern as a continuation pattern. In simple terms, this means that when the symmetrical triangle breakout happens, the price is more likely to move in the same direction as the trend that came before the triangle.
- A bullish symmetrical triangle pattern forms during an uptrend. When the price breaks out above the triangle, the upward movement resumes.
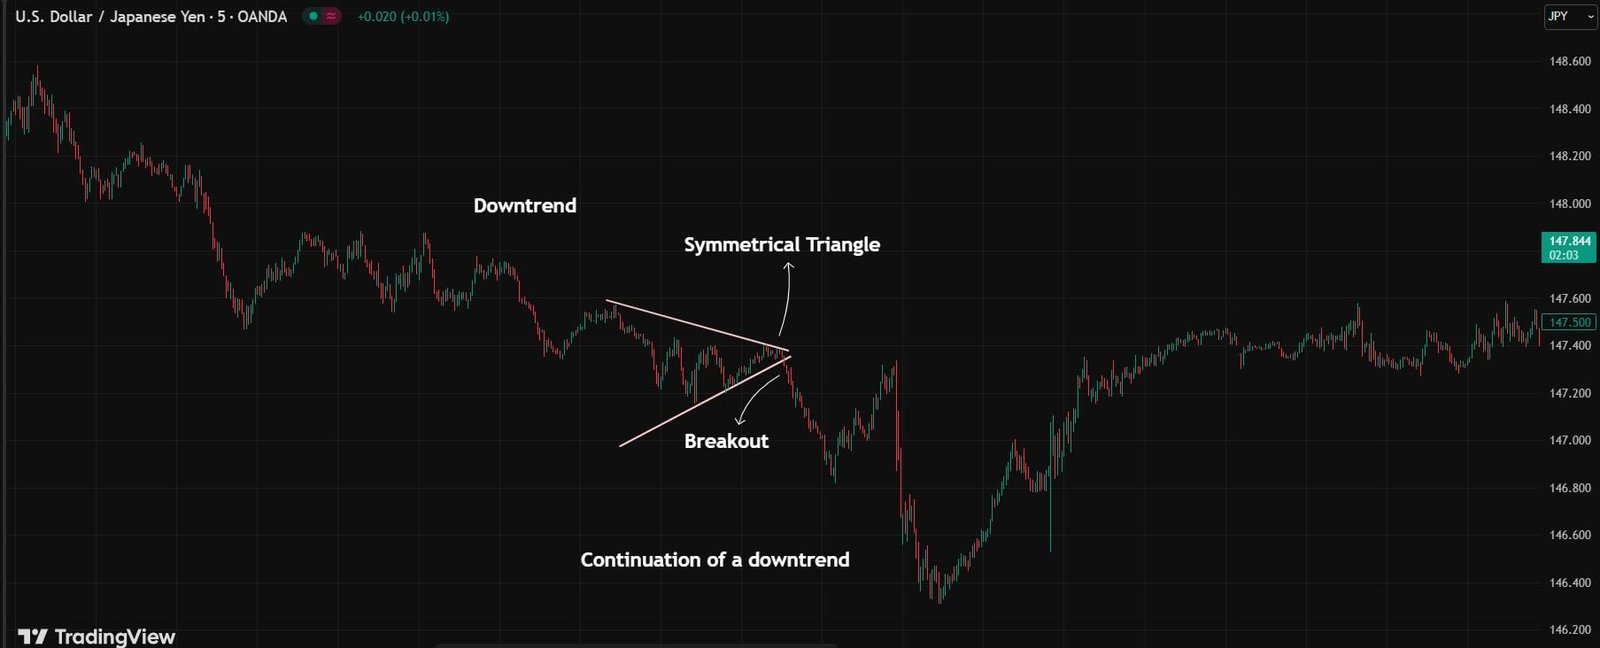
- A bearish symmetrical triangle pattern forms during a downtrend. When the price breaks out below the triangle, the downward movement resumes.
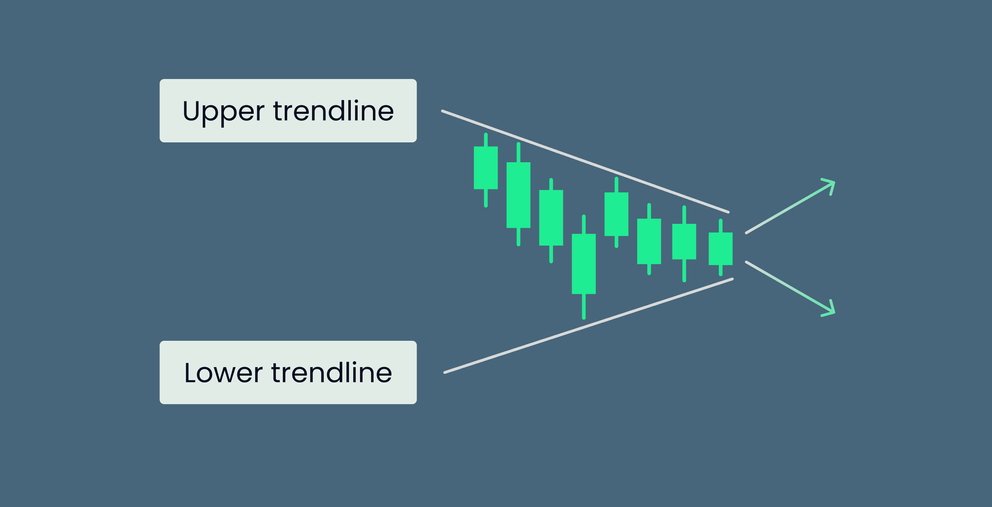
That said, it’s not always the case. A reversal can still happen. Sometimes the price breaks out in the opposite direction, though this is less common. This usually occurs if the balance of power between buyers and sellers changes sharply during the consolidation phase inside the triangle.
Market Psychology Behind the Symmetrical Pattern
In everyday language, symmetry means balance, when two sides match or mirror each other. The same concept also exists in trading with the symmetrical triangle pattern.
Here’s how it works: as the pattern forms, the resistance line slopes downward and the support line slopes upward. Both lines gradually move closer together until they meet at a single point, called the apex. Because they converge at roughly the same angle, the shape looks even and balanced.
This balance also tells us something about market behavior:
- Sellers are stepping down little by little, which creates lower highs.
- At the same time, buyers are stepping up gradually, which creates higher lows.
- Since neither side is clearly in charge, the price gets squeezed evenly between the two lines.
That’s what makes the symmetrical triangle different from ascending or descending triangles. While those patterns lean in one direction, the symmetrical triangle reflects a tug-of-war where both sides are matched more evenly, until one finally breaks through.
How to Identify a Symmetrical Triangle Pattern
Now that you know what a symmetrical triangle pattern is, let’s dive a little deeper and look at its main features so you can spot it easily on a chart:
Two Converging Trendlines
The upper trendline is drawn by connecting lower highs, and the lower trendline is drawn by connecting higher lows. When these two lines slope toward each other, they form a triangle that points to the right. That’s your first clue you’re looking at a symmetrical triangle pattern.
At Least Two Touches on Each Side
For the pattern to be valid, the price should touch each trendline at least twice two highs on the upper line and two lows on the lower one. Some traders even believe you need around five touches overall. The more touches, the stronger the pattern tends to be.
Volume Decline
As I mentioned earlier, this pattern shows a kind of “tug of war” between buyers and sellers, which creates uncertainty. During this phase, trading volume usually starts to drop.
Breakout Point
Eventually, the price will break out above or below one of the trendlines, often with a noticeable spike in volume. The breakout usually continues in the same direction as the prior trend, but sometimes it flips and goes the other way.
Timeframe
A symmetrical triangle chart pattern can show up on short intraday charts or stretch out over weeks to months on longer-term charts. Still, the longer the timeframe, the more reliable the pattern tends to be.
Symmetrical Triangle Pattern Trading Guide
If you remember, I mentioned at the start of this article that my goal isn’t just to throw random definitions at you, the kind you can find anywhere online. I want to actually help you learn how to trade by yourself. And this section is where things get more practical, especially with patterns like symmetrical triangles.
Here are 5 simple steps to trade this pattern:
1. Identify the trend
Unlike some other price or candlestick patterns that only show up in a specific trend, like only in an uptrend or only in a downtrend, a symmetrical triangle chart pattern can form in both. The direction of the breakout decides what kind of signal it gives: bullish or bearish.
2. Spot the pattern
Earlier, I explained the psychology behind this pattern: buyers and sellers are basically in balance. That’s why these patterns often show up when the market is “pausing” in a correction before it continues in its original direction. So, keep an eye out for bearish or bullish symmetrical triangle patterns during those corrective phases.
3. Wait for confirmation
Once the pattern takes shape, don’t rush in right away. Instead, watch the price action and wait for solid confirmation, like a symmetrical triangle breakout, a technical indicator, or even candlestick signals such as Engulfing or Tweezer patterns.
To make your chances stronger, it’s smart to wait for the price to retest the broken trendline (aka a pullback). When the price pulls back and tests that same level again, that’s a strong sign the breakout is real.
4. Place your entry
After you’ve got confirmation, it’s time to enter. If the market is in an uptrend and the price breaks out above the triangle, you can go long (buy). If it’s a downtrend and the price breaks below, you can go short (sell). Easy as that, no need to overcomplicate it.
5. Set stop-loss and take-profit levels
Risk management is key here. In an uptrend, you can place your stop-loss (SL) just below the latest major swing lows, strong support levels, or the triangle’s broken trendline. Your take-profit (TP) can go near potential resistance levels further up.
For a downtrend, flip it around: place your SL above the recent swing highs, resistance levels, or the broken trendline. Then, set your TP around potential support areas further down.
Trading Symmetrical Triangle Patterns: Bullish Example
To really get to the point and see how a symmetrical pattern works and what the best time actually is to trade it, I looked at two real examples: one in an uptrend and one in a downtrend.
In the first case, the price was moving up, then took a short pause (a consolidation), and formed a bullish symmetrical triangle pattern. During this pause, the buying pressure slowed down while two trend lines started to converge. By the end of the pattern, buyers came back in and pushed the price to break out above the trendline. Like I mentioned before, when a breakout happens above the pattern, it usually signals the uptrend is likely to continue, and that’s exactly what happened here.
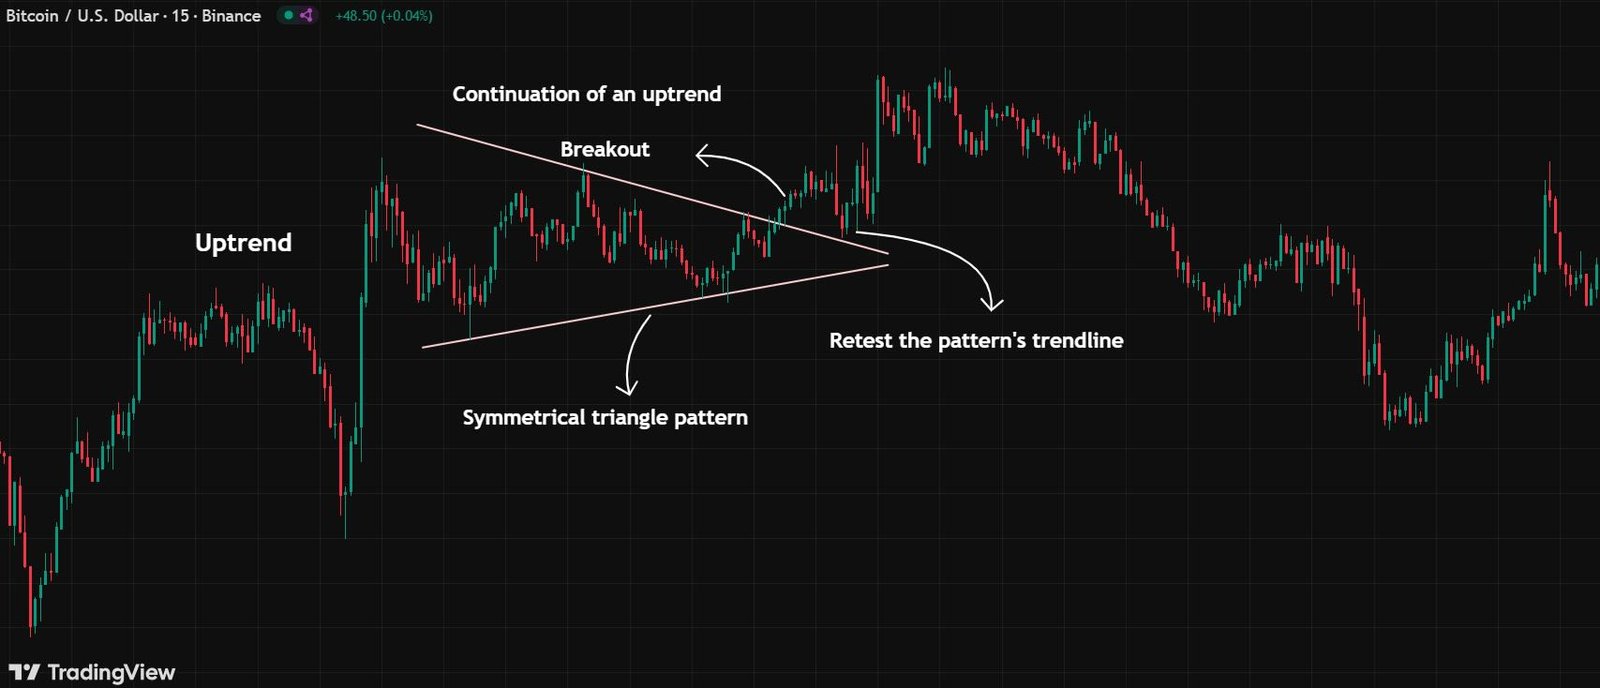
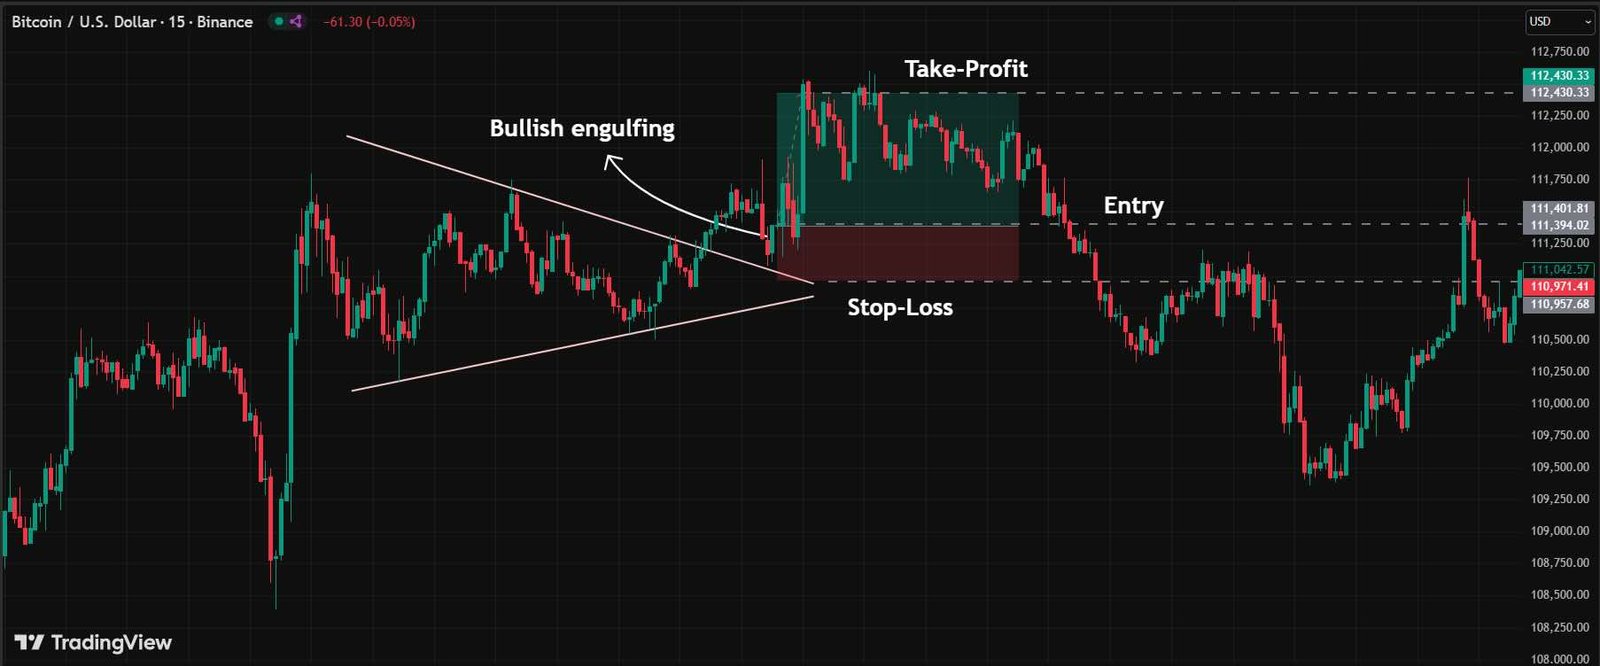
If you want to enter a trade in this kind of setup, it’s better to wait for confirmation signs. For example, after the breakout, you might see the price pull back and retest the trendline, along with a bullish engulfing candlestick (like the one marked in the chart below). That’s your green light.
Here’s how you could set it up:
- Place your entry right after the bullish engulfing candle closes, following the pullback.
- Set your take profit near the previous swing highs.
- Put your stop-loss just below the previous swing lows or under the lower trendline.
Trading Symmetrical Triangle Patterns: Bearish Example
As you can see, the price was moving in a downtrend before it slowed down and entered a consolidation phase. During this time, the selling pressure decreased, and a bearish symmetrical triangle pattern formed right in the middle of the downtrend. After a short pause, the price broke to the downside. This breakout suggested that the trend could keep moving in the same direction.
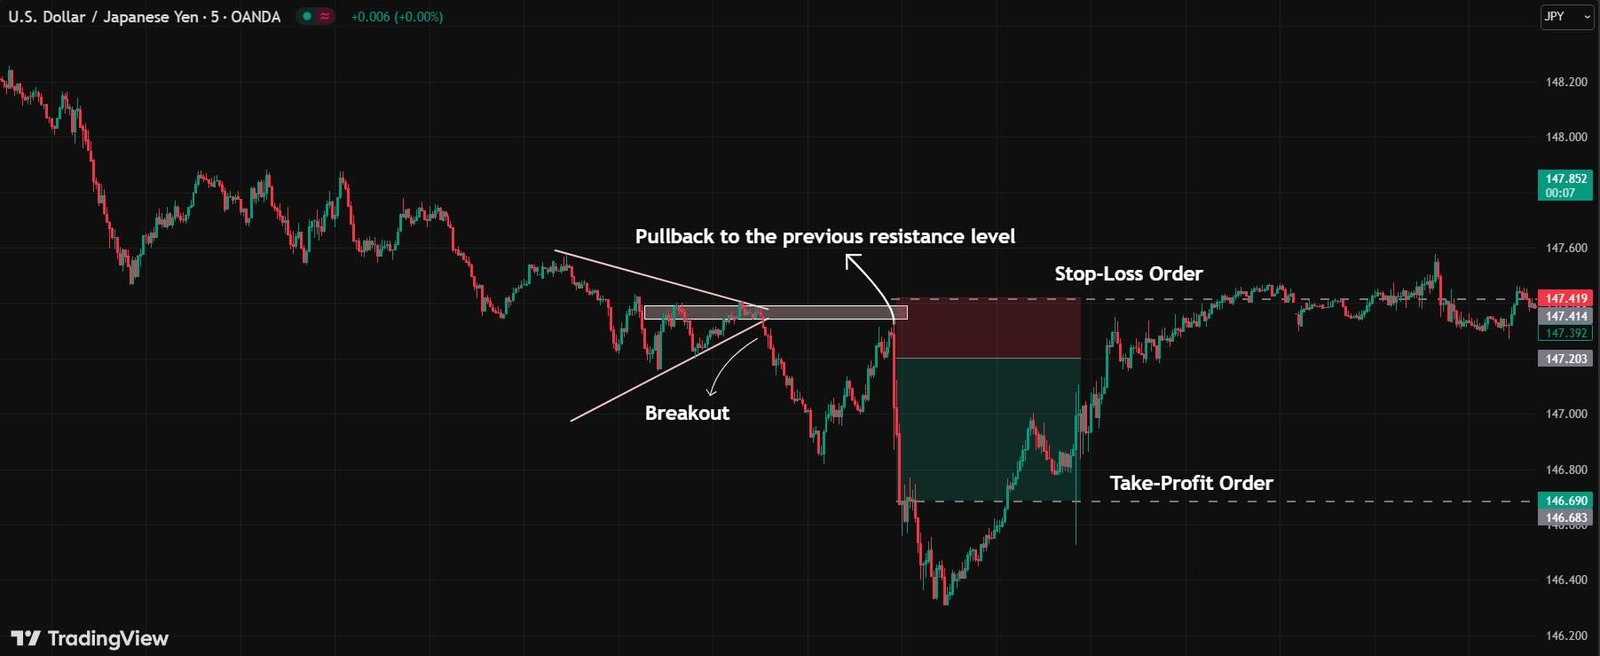
To be more confident, I waited for confirmation. That came when the price pulled back to the previous resistance level. At that point, I entered a short position.
Here’s how you can set it up:
- Enter the trade once the price pulls back and forms a bearish candle.
- Place your stop-loss just above the previous resistance level.
- Place your take-profit order below the last swing lows.
Top 5 Trading Tips when Trading Symmetrical Triangle Patterns
Just like with other candlestick or chart formations, there are a few practical tips that can make trading symmetrical patterns more effective. Keep these points in mind:
1. Know the Traits of the Pattern
It’s not enough to just recognize the pattern! Understanding how the market usually reacts during a symmetrical price pattern is key. This helps you gauge momentum and the trader’s psychology.
2. Wait for Strong Signals
Instead of entering too early, it’s safer to wait for confirmation. You can rely on pullbacks, technical indicators, candlestick signals, or even other chart setups to validate your entry point.
3. Protect Yourself with Orders
Good trading plans always include stop-loss and take-profit levels. Whether it’s a triangle or another pattern, these ensure you lock in profits and manage risks properly.
4. Test Before Going Live
Practice is essential. Try out triangle strategies on a demo account first. Once you’ve developed your method and built confidence, then shift to real trades.
5. Stick to Risk Management
Define clear rules for trade size, stop placement, and profit-taking. A disciplined plan keeps emotions out of your decisions and increases your consistency over time.
Conclusion
All in all, symmetrical triangle patterns can show up in both uptrends and downtrends. Most traders see them as continuation patterns, meaning a breakout above the trendline often confirms an uptrend, while a breakout below the lower trendline signals a downtrend.
I hope this article helps you get a better grasp of these patterns and how to trade them effectively on a chart. If you’ve got any questions, feel free to ask them in the comments below.


