Head and Shoulders pattern: It might sound like something from a shampoo ad, but in trading, it’s one of the most useful chart patterns you can learn. Don’t worry if it seems a little strange at first; once you understand it, you’ll see why traders rely on it to spot potential trend reversals. In this article, I’ll break it down step by step, show you how to identify it on a chart, and explain how you can trade it with confidence for better results.
- The head and shoulders pattern is a chart formation that signals a potential reversal, usually from bullish to bearish.
- It has three parts: the left shoulder, the head (highest peak), and the right shoulder
- The inverted head and shoulders pattern is the opposite and signals a reversal from bearish to bullish.
- A regular head and shoulders appears at the end of an uptrend, while an inverted one shows up at the end of a downtrend.
- The neckline is the critical support or resistance line that confirms the pattern once broken
- In a head and shoulder chart pattern, the trade is triggered when the price breaks below the neckline and retests it.
- In an inverted pattern, the trade is triggered when the price breaks above the neckline and retests it.
What Is the Head and Shoulders Pattern?
Just like the name says, the head and shoulders pattern looks exactly like a head with two shoulders on the chart. Simple, right? If you remember when I talked about other chart patterns, like the Double top and bottom, wedge, or ascending and descending triangle patterns, I mentioned how they usually resemble their names. Same deal here.
The head and shoulders pattern has three main parts: the left shoulder, the head, and the right shoulder. It usually shows up after an uptrend and signals that the bullish momentum is losing steam. In plain words, it’s often a sign that the trend might flip from bullish to bearish. So yeah, the head and shoulders is basically a bearish reversal pattern.
Understanding the Inverted Head and Shoulders Pattern
When I talk about head and shoulders patterns, there’s also a flipped version called the inverted (or inverse) head and shoulders. Basically, it’s the same idea, just upside down.
Instead of forming at the top of an uptrend, this one shows up at the bottom of a downtrend. You’ll see a left inverted shoulder, an inverted head, and then an inverted right shoulder. What does that mean? It signals that the bearish momentum is running out of gas, and the trend could turn around from bearish to bullish. Pretty handy if you’re watching for reversals.
How to Identify the Head and Shoulders Pattern
A head and shoulders pattern is made up of three peaks that look like, well, a head and two shoulders. The middle peak (the head) is higher than the two shoulders on each side.
The inverted version is just the opposite. Instead of peaks, it’s formed by three lows, where the middle low (the head) is lower than the two shoulders around it. Think of it as an upside-down head and shoulders.
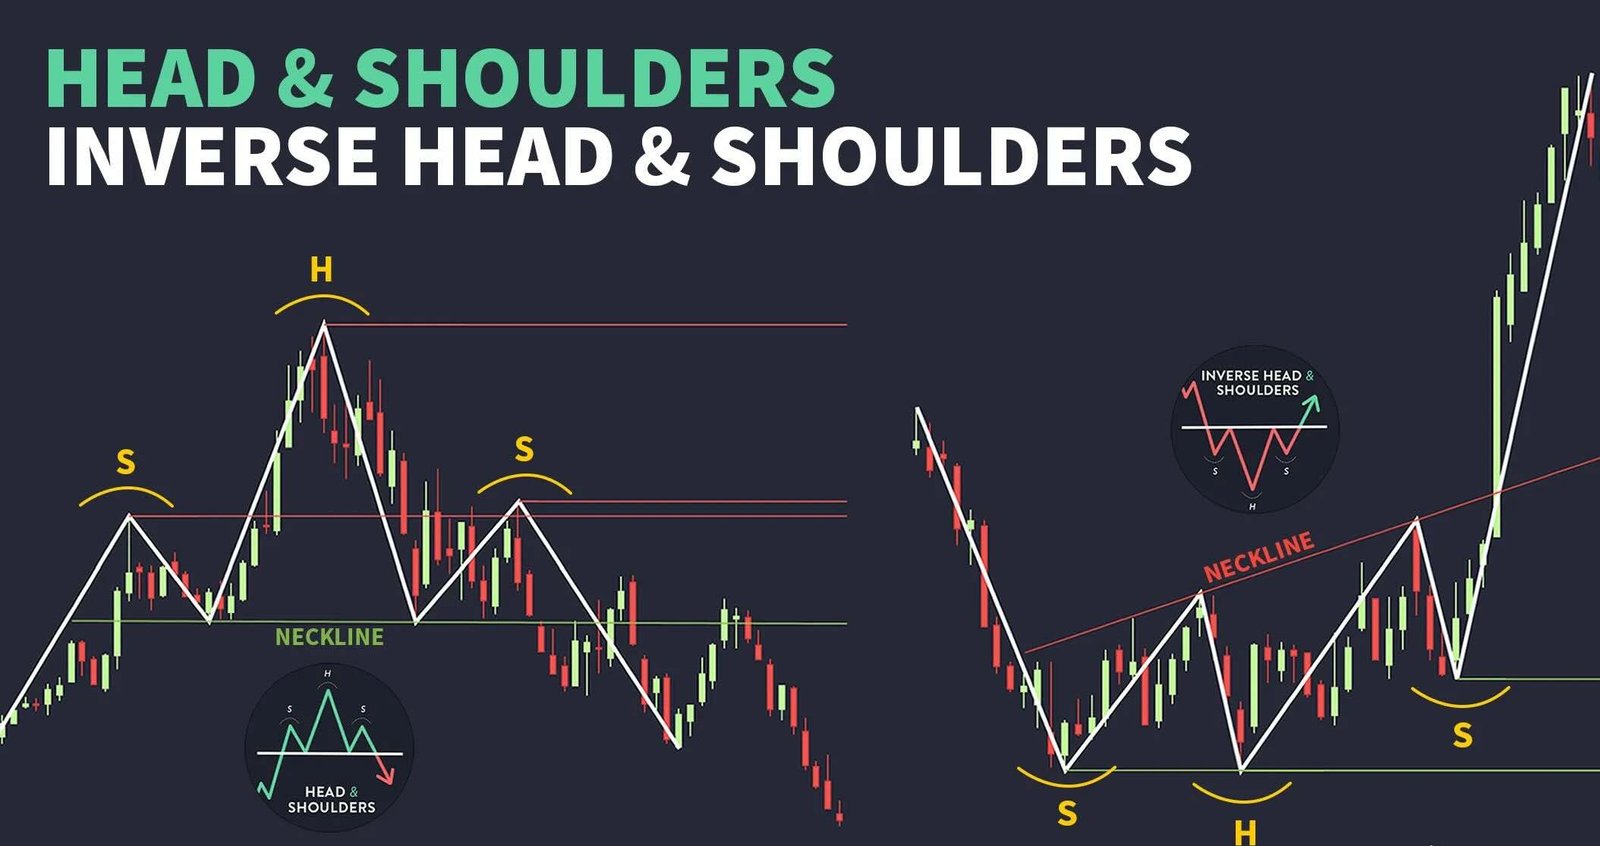
Now, let me walk you through how to spot these patterns step by step:
1. Spot the trend
A regular head and shoulders shows up at the end of an uptrend. On the other hand, an inverted head and shoulders pattern shows up at the end of a downtrend. So, the first thing I do is figure out the overall trend and mark the support and resistance zones.
2. Spot the left shoulder
In the head and shoulders chart pattern, the left shoulder is the first peak near the resistance line after an uptrend.
In an inverted head and shoulders, the left shoulder is the first dip (or low) near the end of a downtrend.
3. Observe the head
Next comes the head. In the regular version, the price pushes higher than the left shoulder and creates a new peak, the tallest one in the pattern.
In the inverted version, the price drops lower than the left shoulder and forms the deepest low.
4. Identify the right shoulder
After the head forms, the price pulls back. Then it tries to rise (or drop, in the inverted version) again, but this move is weaker. That’s how the right shoulder is formed. It looks a lot like the left shoulder and shows that momentum is fading.
5. Draw the neckline
The neckline is the line you draw connecting the two shoulders.
- In a head and shoulders, the neckline acts as a support level. The pattern becomes valid when the price breaks below it.
- In an inverted head and shoulders pattern, the neckline acts as a resistance level. The pattern becomes valid when the price breaks above it.
How to Trade the Head and Shoulders Pattern
Now that you know what a head and shoulders pattern (and the inverted version) looks like, let’s take it a step further and go over the five key steps to trading these patterns:
1. Find the key resistance and support levels
Before the head and shoulders pattern forms, there’s usually an uptrend. Since this pattern signals a shift from uptrend to downtrend, the first thing I do is look for strong resistance areas.
For an inverted head and shoulders, I flip it around and look for strong support levels where the pattern starts forming with the first inverted shoulder.
2. Identify the head and shoulders pattern
After spotting resistance (or support), I check the chart to see if the head and shoulders shape is forming, just like I explained earlier.
3. Entry point and trade execution
Once the pattern is complete, I wait for confirmation before entering a trade. For a regular head and shoulders, confirmation comes when the price breaks below the neckline and then pulls back to retest it from underneath. That’s when I look to enter a short position.
For an inverted head and shoulders chart pattern, I enter a long position when the price breaks above the neckline and then retests it with a pullback.
4. Stop-loss order placement
Sometimes, price action creates a fake breakout, leading to a failed head and shoulders pattern. That’s why I always rely on a stop-loss order to protect myself from unnecessary losses. In the head and shoulders chart pattern setup, the stop-loss usually goes above the right shoulder, the head, or the key resistance level.
In an inverted version, the stop-loss goes below the right shoulder, the head, or the key support zone.
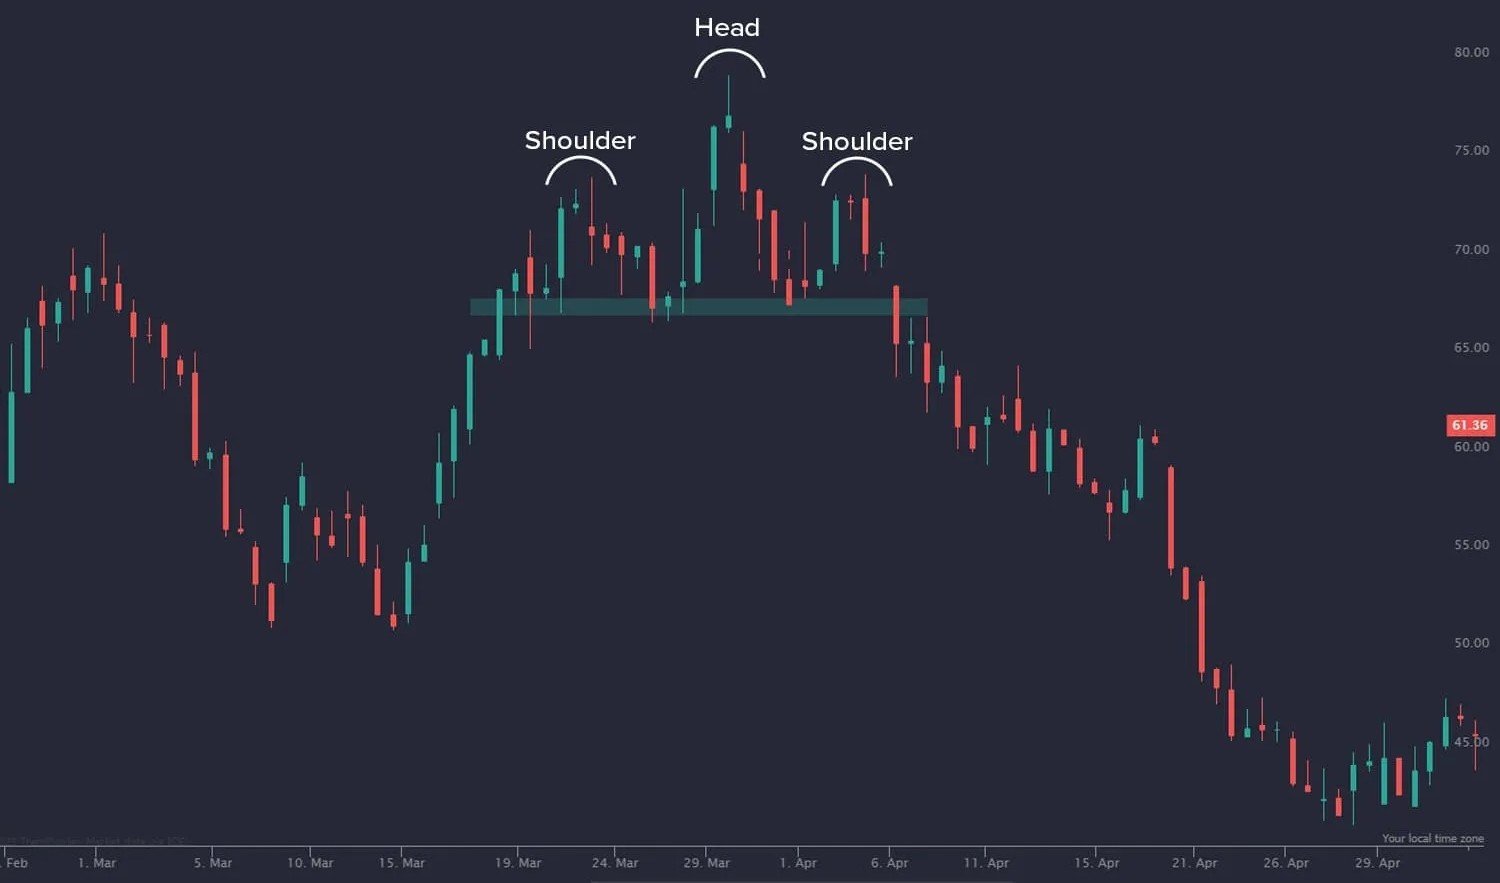
Trading Head and Shoulders Pattern: Real Scenario
Alright, let me put together everything I explained about the head and shoulders pattern, along with the inverted version, and try it out on a chart.
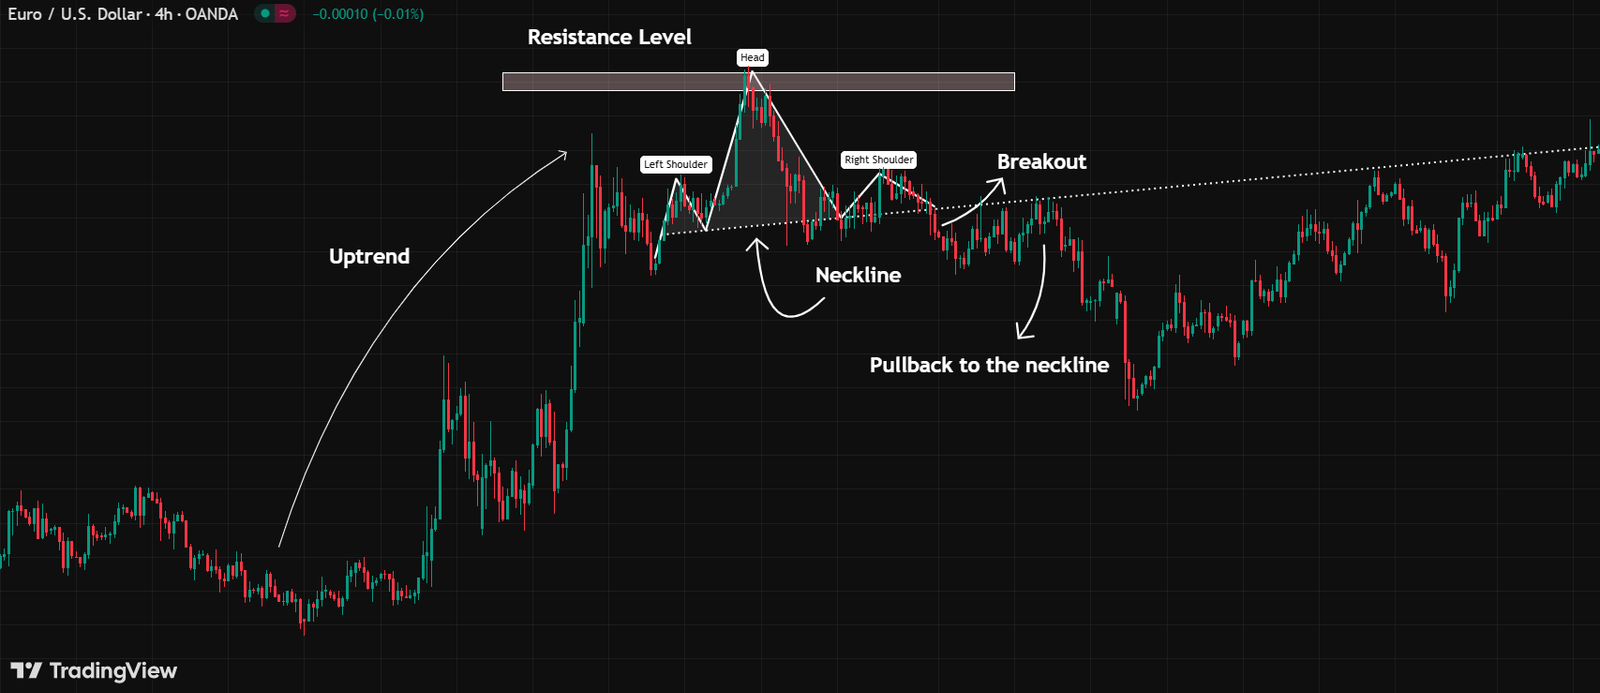
In the chart below, the price was moving in an uptrend until it hit a resistance zone. At that point, selling pressure stopped it from pushing higher. First, the price formed a left shoulder. Then it climbed again to create a higher high, which became the head of the pattern. However, it couldn’t keep going up, and instead it dropped back, forming another peak at about the same level as the left shoulder. That gave me the right shoulder.
I drew the neckline on the chart, and the price broke below it, then came back to test it again, creating a pullback. When I see this setup, I expect the trend to shift from bullish to bearish, since the pullback confirms the pattern.
Here’s how I would trade it:
- I would place my stop loss just above the neckline.
- I would enter the trade after a strong bearish candle with a solid body close.
- I would set my take profit near the previous swing lows to determine the head and shoulders pattern target.
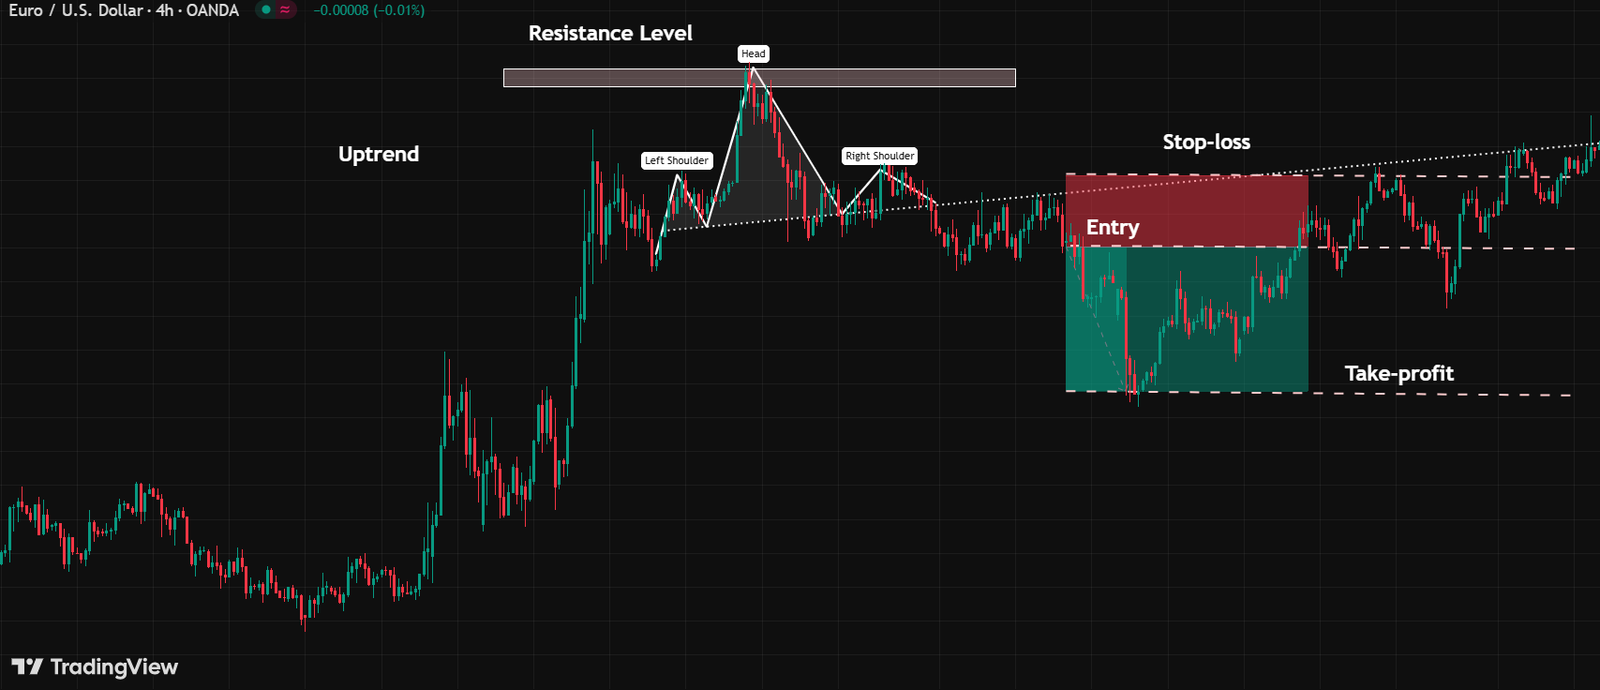
This way, I’m not just guessing; I’m following the head and shoulders pattern step by step, which makes the trade a lot more reliable.
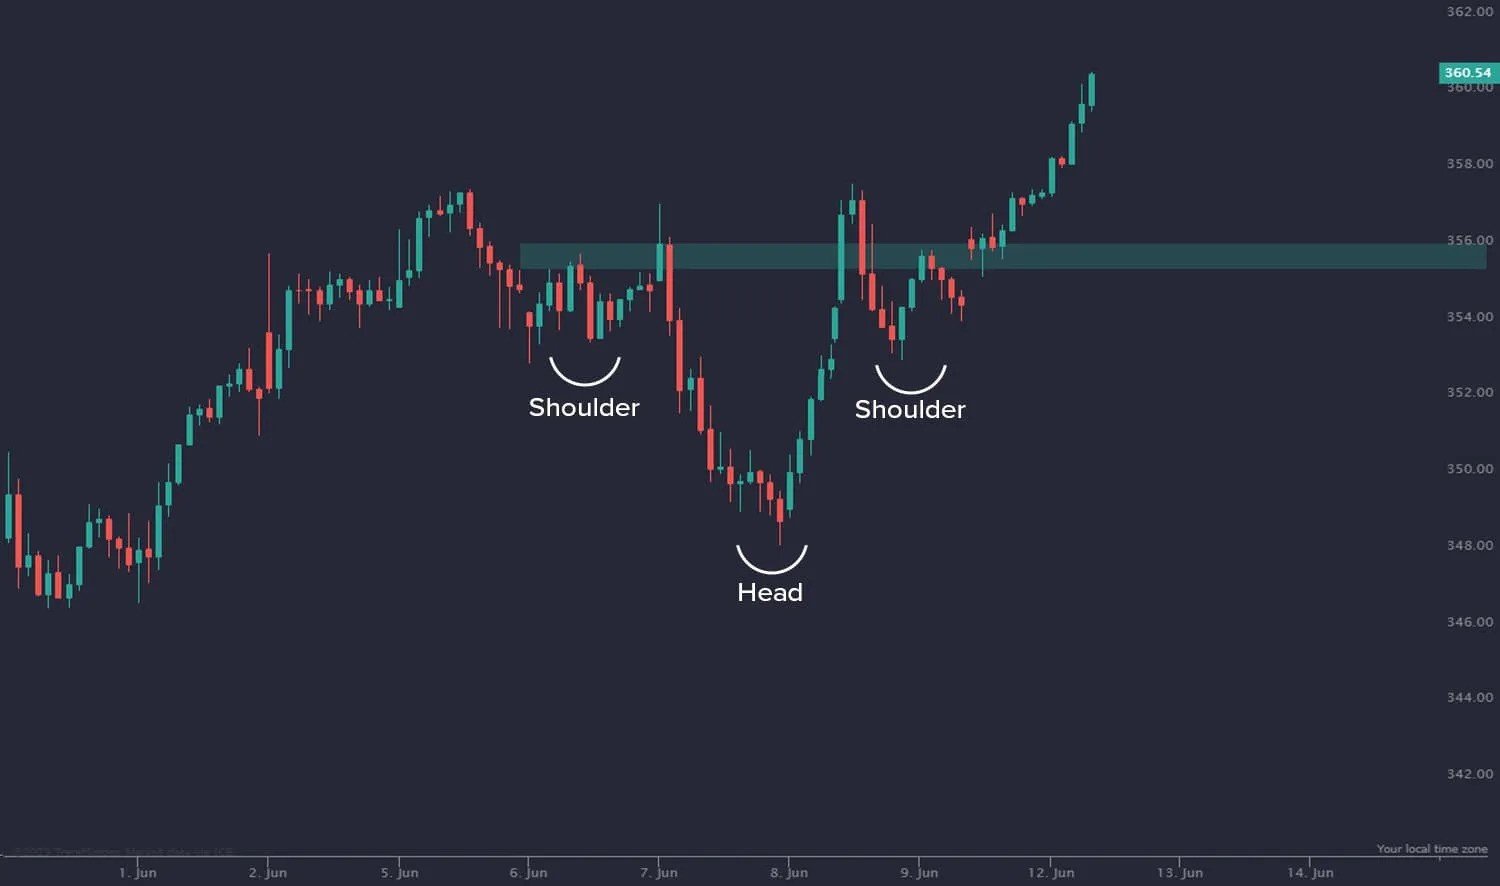
Trading Inverted Head and Shoulders Pattern: Real Scenario
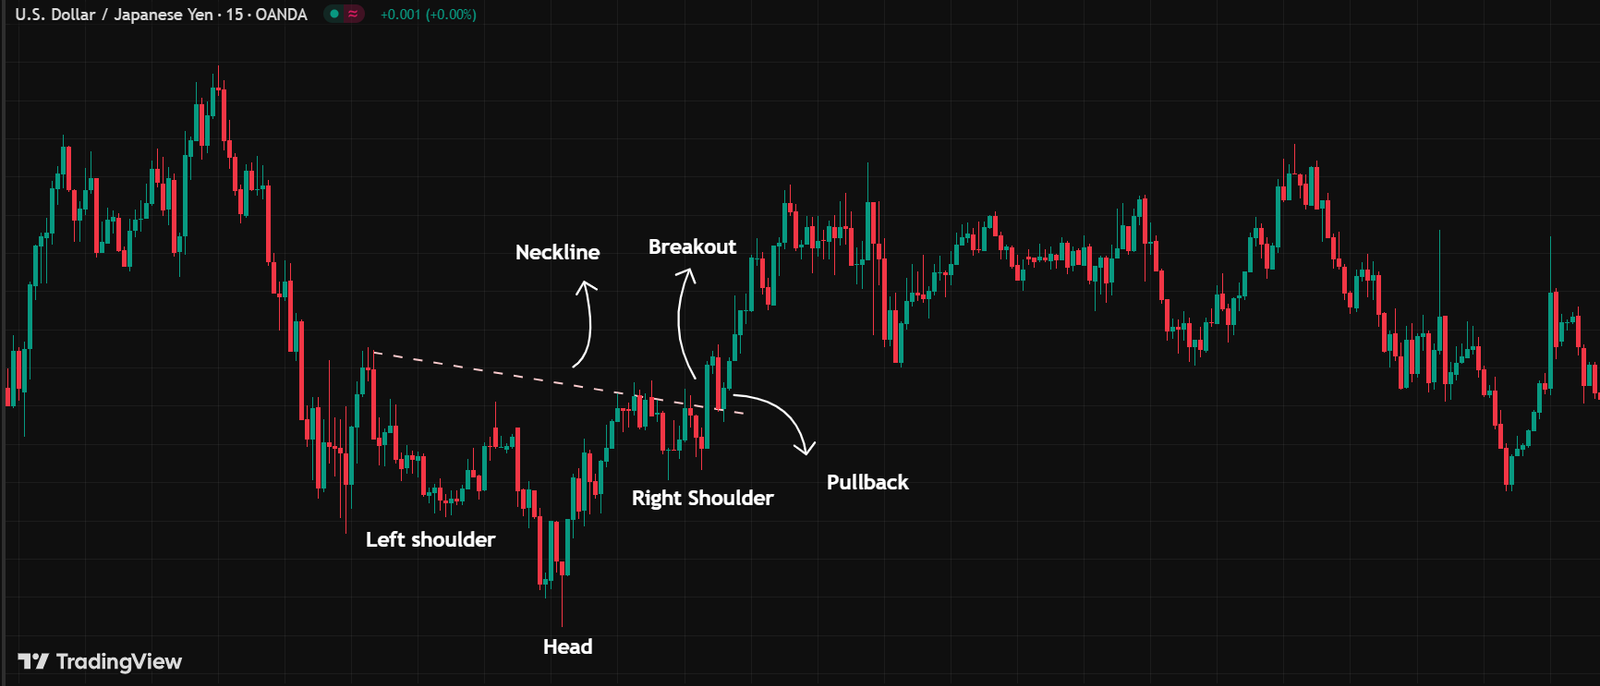
In the example below, after a sustained downtrend, the price found strong support where buyers stepped in and stopped it from falling further. From there, the market formed a left shoulder. Then it dropped again to make a deeper low, which became the head of the pattern. But sellers couldn’t push it down any further, and instead, a higher low appeared, forming the right shoulder at about the same level as the first.
I drew the neckline on the chart, and once the price broke above it, it pulled back to retest that level before moving higher. This kind of setup often signals a shift from bearish to bullish, confirming the inverted head and shoulders pattern.
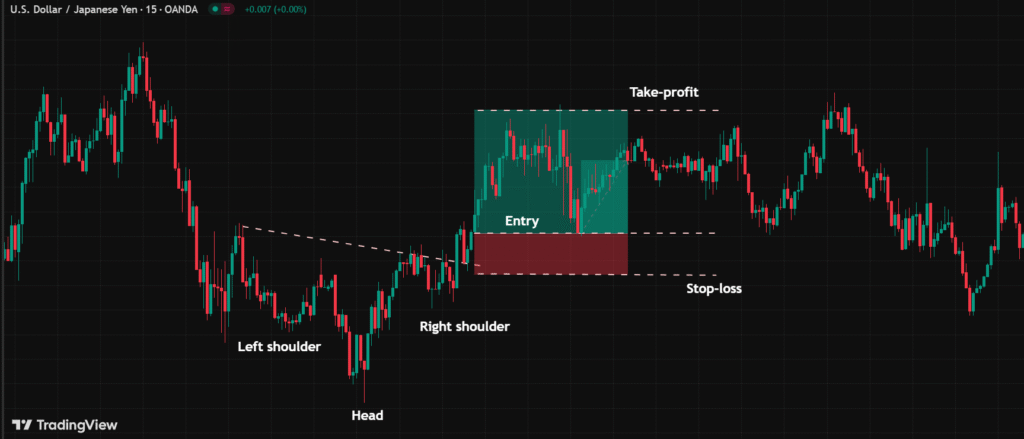
Here’s how I would plan a trade around it:
- I would place my stop loss just below the neckline.
- I would enter a long position after a strong bullish candle closes above the neckline.
- Regarding the inverse head and shoulders pattern target, I would set my take profit close to the previous swing highs or previous resistance zones.
Conclusion
Alright, that’s a wrap on the head and shoulders pattern, along with its opposite version, the inverse head and shoulders pattern. Both of them are reversals: the regular head and shoulders chart pattern usually points to a bearish turn, while the inverse version hints at a bullish reversal. Pretty cool, right?
Now it’s your turn! Try spotting these patterns on a chart and see how they play out. The more you practice, the sharper your trading eye will get!
FAQ
What is the head and shoulders pattern?
The head and shoulders pattern is a reversal chart pattern that consists of three peaks: a higher peak in the middle (the “head”) and two lower peaks on either side (the “shoulders”).
Is the head and shoulders pattern bullish?
No, the head and shoulders pattern is a bearish reversal pattern. It typically appears at the end of an uptrend and signals a potential shift from bullish to bearish.
What happens after a head and shoulders pattern?
After a head and shoulders pattern forms, it usually hints at a bearish reversal, meaning the market trend often shifts from upward (bullish) to downward (bearish).
What is an inverted head and shoulders pattern?
An inverted (or inverse) head and shoulders pattern is the opposite of the regular head and shoulders pattern. It is a bullish reversal pattern that appears at the end of a downtrend, signaling a potential shift from bearish to bullish.


