Cup and Handle Pattern: Another strange name in trading, but don’t let that throw you off; this one’s actually super useful. The Cup and Handle comes in two forms: the classic version, which is a bullish pattern, and the inverted version, which is bearish.
At first, you might wonder what a “cup and handle” has to do with trading, but once you see it on the chart, it clicks. This pattern helps traders spot potential trading opportunities, giving them a clearer picture of what might come next.
So, without wasting any time, let’s dive in, see how both versions work, and check out a few real examples to understand how this pattern can actually guide your trades.
- The Cup and Handle pattern, introduced by William J. O’Neil, is a bullish continuation pattern that signals the potential continuation of an uptrend after a consolidation phase.
- It visually resembles a rounded “cup” followed by a smaller pullback or “handle”, representing a pause before the next upward move.
- The inverted version of the pattern (Inverse or upside down cup and handle) appears during downtrends and signals the continuation of bearish momentum.
- The pattern’s logic is based on sellers losing control during the cup phase and buyers regaining strength at the breakout above the handle.
- A retest of the neckline after breakout often offers a safer entry point for traders seeking confirmation.
- The Cup and Handle pattern works best on daily or weekly timeframes, as shorter ones often produce unreliable signals.
What Is the Cup and Handle Pattern?
As the name suggests, the Cup and Handle pattern looks just like a tea cup, a rounded “cup” followed by a smaller pullback or consolidation that forms the “handle.”
This pattern was first introduced by William J. O’Neil, a well-known stock trader and author of How to Make Money in Stocks. It’s known as a continuation pattern, showing that after a short pause or consolidation, the price often continues in the same direction, usually upward, once it breaks above the resistance level.
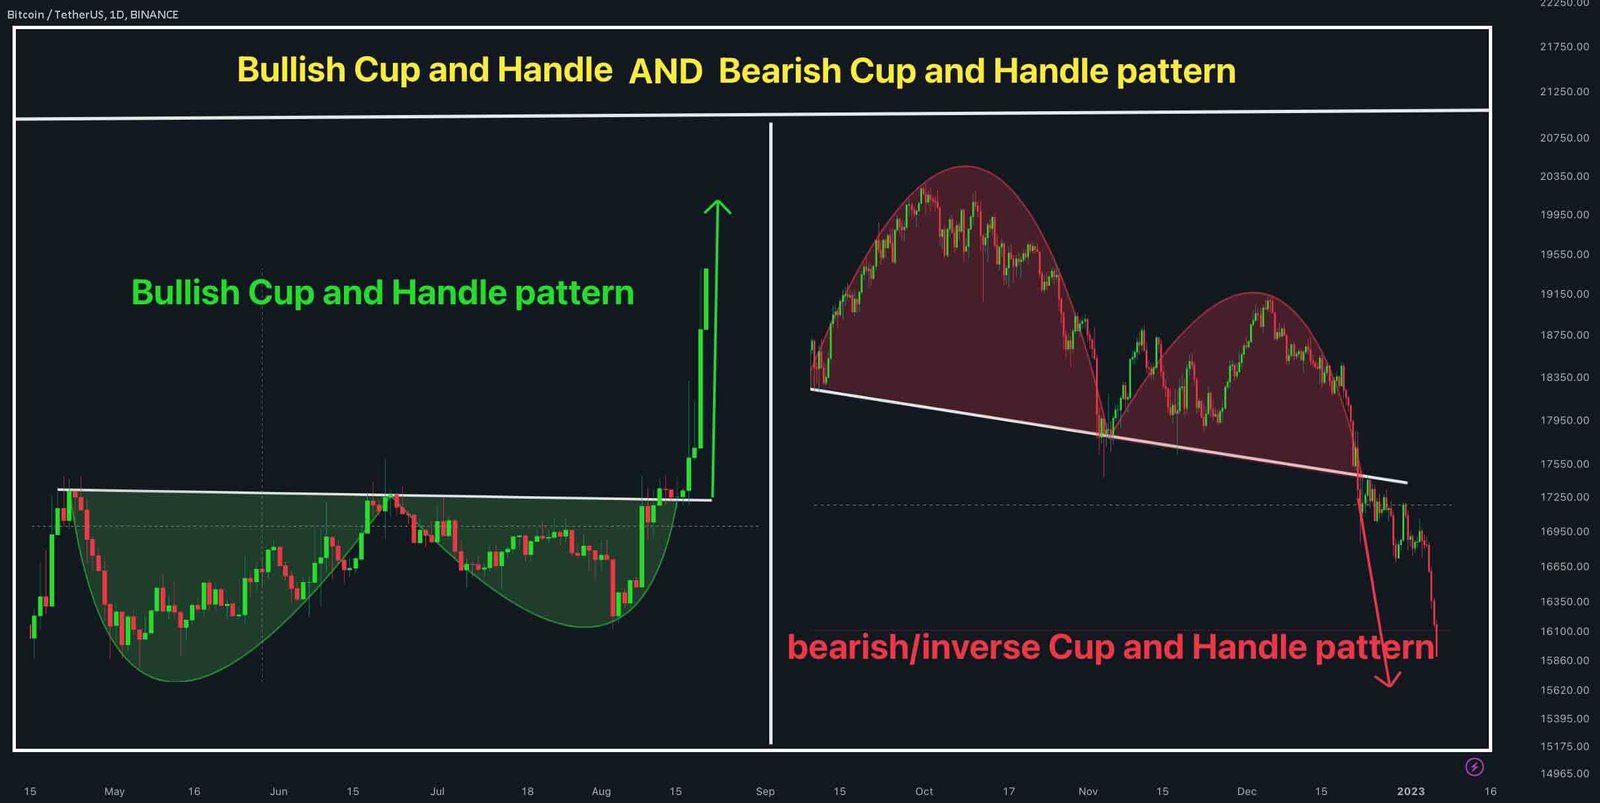
Like many other chart formations that come with reversed versions, such as the Head and Shoulders pattern, the Cup and Handle also has an opposite form. The Inverted Cup and Handle usually appears in a downtrend and signals the possible continuation of bearish momentum.
That’s the basic idea. Now let’s move on to the next section, where we’ll dive deeper into how this pattern works and check out some real chart examples.
Cup and Handle Pattern Key Characteristics
The Cup and Handle is a bullish continuation pattern often used in technical analysis. It has three key parts:
- Cup: A rounded, U-shaped bottom that forms after an uptrend. This shows a period of correction or consolidation where sellers slowly lose control.
- Handle: A small downward or sideways move that appears after the cup, representing a short pause before the next move up.
- Breakout: Once the handle forms, the price typically breaks above the rim (neckline), the resistance level at the top of the cup, where both sides of the “U” meet.
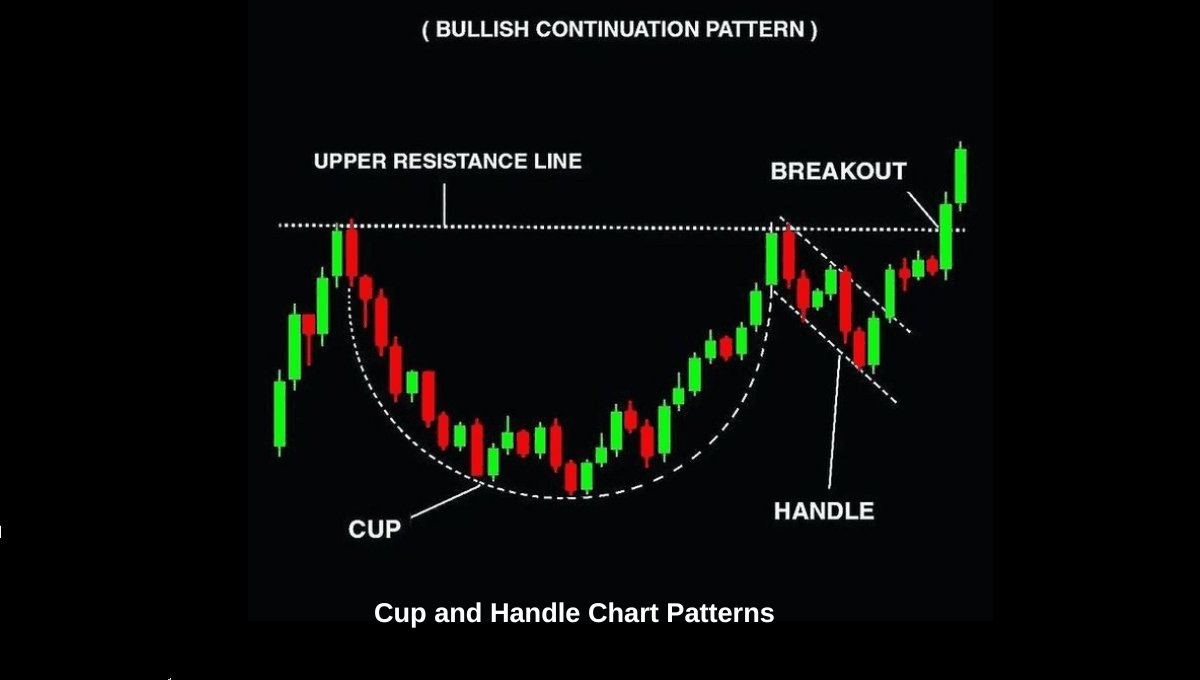
But what does this shape really tell us? By now, you probably get the basic idea, yet it’s worth digging into why it works.
Here’s the logic: the pattern starts with an uptrend, showing buyers in charge. As the price moves downward to form the cup, selling pressure fades while buyers slowly regain control, creating a smooth, rounded bottom, a sign of healthy consolidation. When the price gets close to the previous high, a small pullback forms the handle, shaking out weak hands and building momentum. Finally, a breakout above the handle’s resistance (ideally on high volume) confirms a solid buying strength and often signals the continuation of the prior uptrend.
Cup and Handle vs. Inverted Cup and Handle at a Glance
To fully compare these two patterns, here is a brief comparison at a glance.
| Feature | Cup and Handle Pattern | Inverse Cup and Handle Pattern |
|---|---|---|
| Type | Continuation (Bullish) | Continuation (Bearish) |
| Typical Market Context | Appears during an uptrend, signaling upward movement | Appears during a downtrend, signaling downward movement |
| Shape | Looks like a bowl with a small dip (handle) on the right side | Looks like an inverted cup with a small rise (handle) on the right side |
| Price Action Direction | Signals a potential breakout to the upside | Signals a potential breakout to the downside |
5 Steps to Trade the Cup and Handle Pattern
Let’s move on from the theory and go through the five main steps to trade the cup and handle pattern effectively.
1- Identify the trend
Since the Cup and Handle usually form within an uptrend, your first step, even before spotting the pattern, is to confirm that the market is trending upward. The pattern usually works as a continuation signal, suggesting that the bullish move is likely to continue once the handle completes.
For the inverted (bearish) version, do the opposite: confirm that the market is in a downtrend, since this setup forms during declines and signals the continuation of bearish pressure.
2- Identify the Pattern
Next, ensure you’ve identified the pattern correctly.
In a bullish Cup and Handle pattern, the “cup” looks like a smooth U-shape, followed by a smaller pullback or consolidation that forms the handle.
In an inverted version, it’s flipped: the cup looks like an upside-down U, followed by a small upward retracement.
3- Confirm the Handle
A valid pattern is confirmed only by a breakout:
- In the bullish setup, a breakout above the rim (or neckline) confirms continuation.
- In the bearish version, a break below the rim confirms downward momentum.
Sometimes, price pulls back to retest the neckline after the breakout; that’s often a stronger and safer entry point.
4- Set Your Entry
For a bullish setup, go long when the price breaks and retests the neckline successfully.
For a bearish setup, enter short after a clean break and retest below the neckline.
You can combine this with indicators or volume analysis to confirm momentum before entering.
5- Place Your Stop-Loss and Take Profits
To protect your trade:
- In a bullish pattern, place your stop-loss just below the handle’s low.
- In a bearish type (reverse cup and handle pattern), set it just above the handle’s high.
For your cup and handle pattern target, measure the height of the cup (from its lowest point to the neckline or rim) and project that distance upward from the breakout in a bullish setup or downward in a bearish one.
By following these five steps, you’ll have a solid framework for identifying and trading both the Cup and Handle and its inverted version. Next, let’s take a look at some real chart examples to see how this strategy plays out in practice.
Cup and Handle Pattern Example
As you can see in the image below, the price initially started an upward move, showing strong bullish momentum as buyers took control of the market. However, after reaching a peak, that upward trend began to lose steam as traders started taking profits. This led to a gradual decline in price, marking the start of a corrective phase. Selling pressure increased, and the market entered a period of consolidation, setting the stage for the formation of the cup pattern.
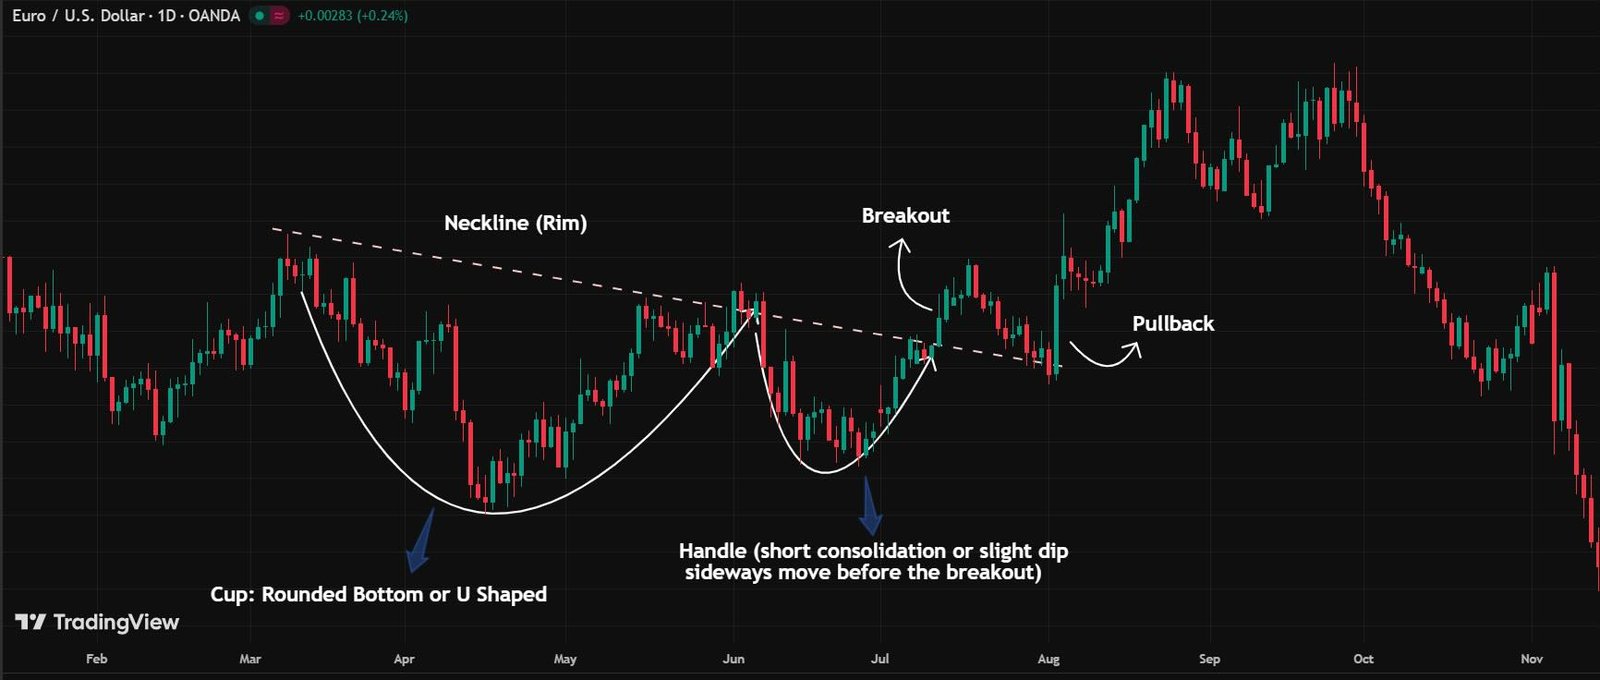
Once the price completed the rounded recovery of the cup and climbed back near its previous high, it moved into a short consolidation phase called the handle, as shown in the image. The decline here was lighter than the cup’s depth, showing that selling pressure was limited and buyers were slowly returning. Trading volume often dropped during this stage, reflecting market hesitation as traders waited for a clear signal. This brief consolidation helped shake out weak holders before the price gathered strength for a potential breakout above the resistance line.
After this short pause, the price broke above the neckline (also called the rim) with strong momentum, confirming a bullish breakout. A slight pullback followed, acting as a retest of the new support, and ultimately signaled the continuation of the overall bullish trend.
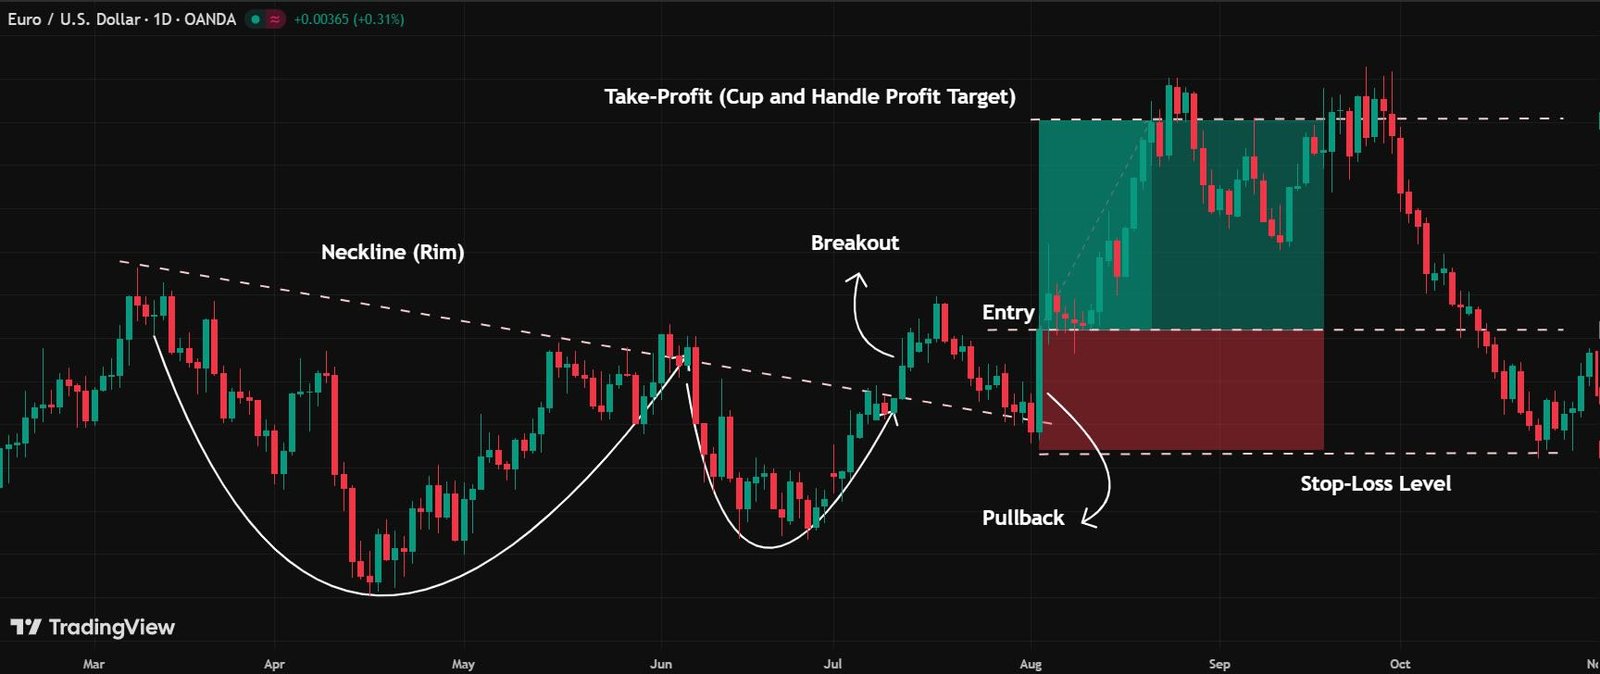
Based on this setup, I adjusted my trade as follows:
- I entered a long position once the price pulled back and a solid green candle closed.
- I placed my Stop-Loss order just below the neckline.
- I set my take-profit target equal to the height of the cup, projected upward from the breakout point.
Inverted Cup and Handle Pattern Example
And here’s the reversed scenario. The price was in a downtrend, showing strong bearish momentum as sellers dominated the market. After reaching a low, the downward movement began to lose strength as short-term buyers stepped in, causing a gradual upward recovery. This recovery formed a rounded top shape, creating the inverted cup pattern.
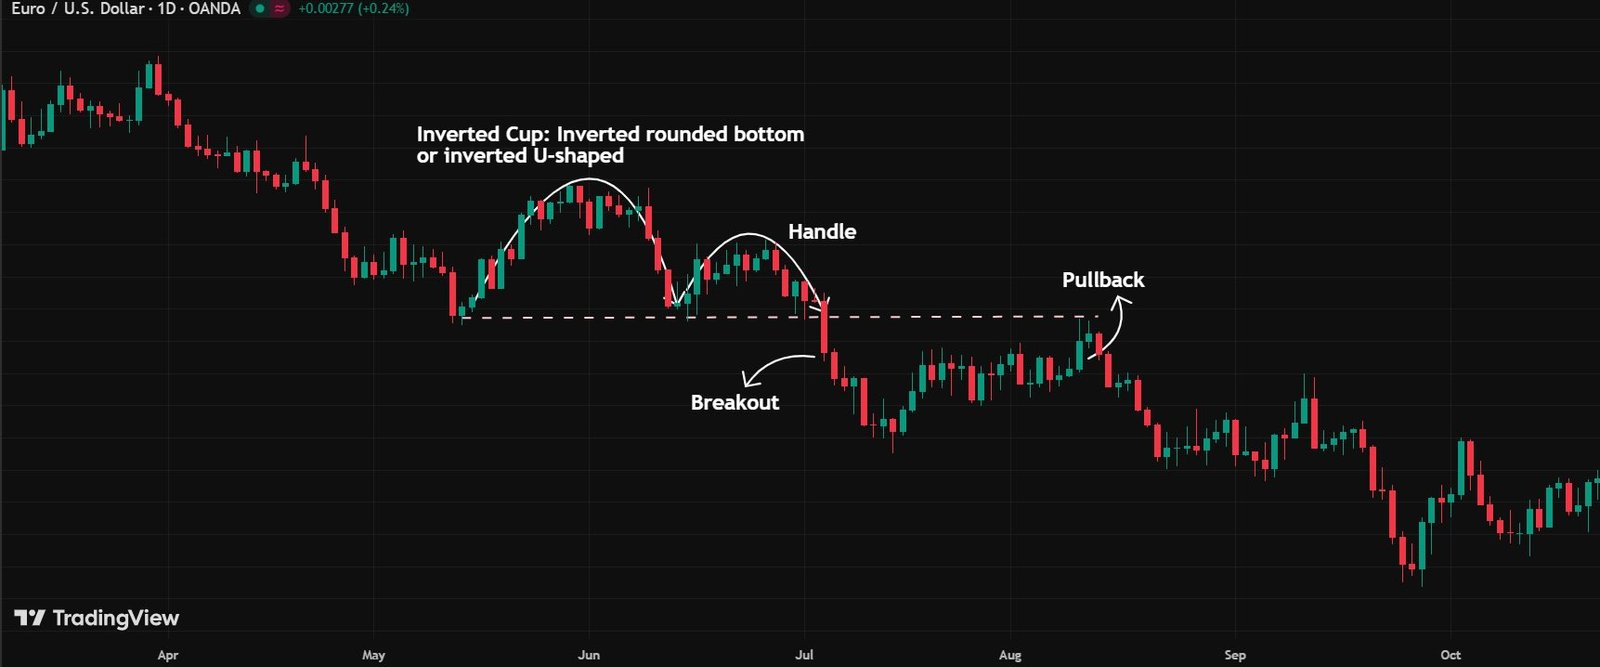
As clearly shown in the image, when the price approached the previous support level, it struggled to hold its upward momentum and started to consolidate, forming the handle this time.
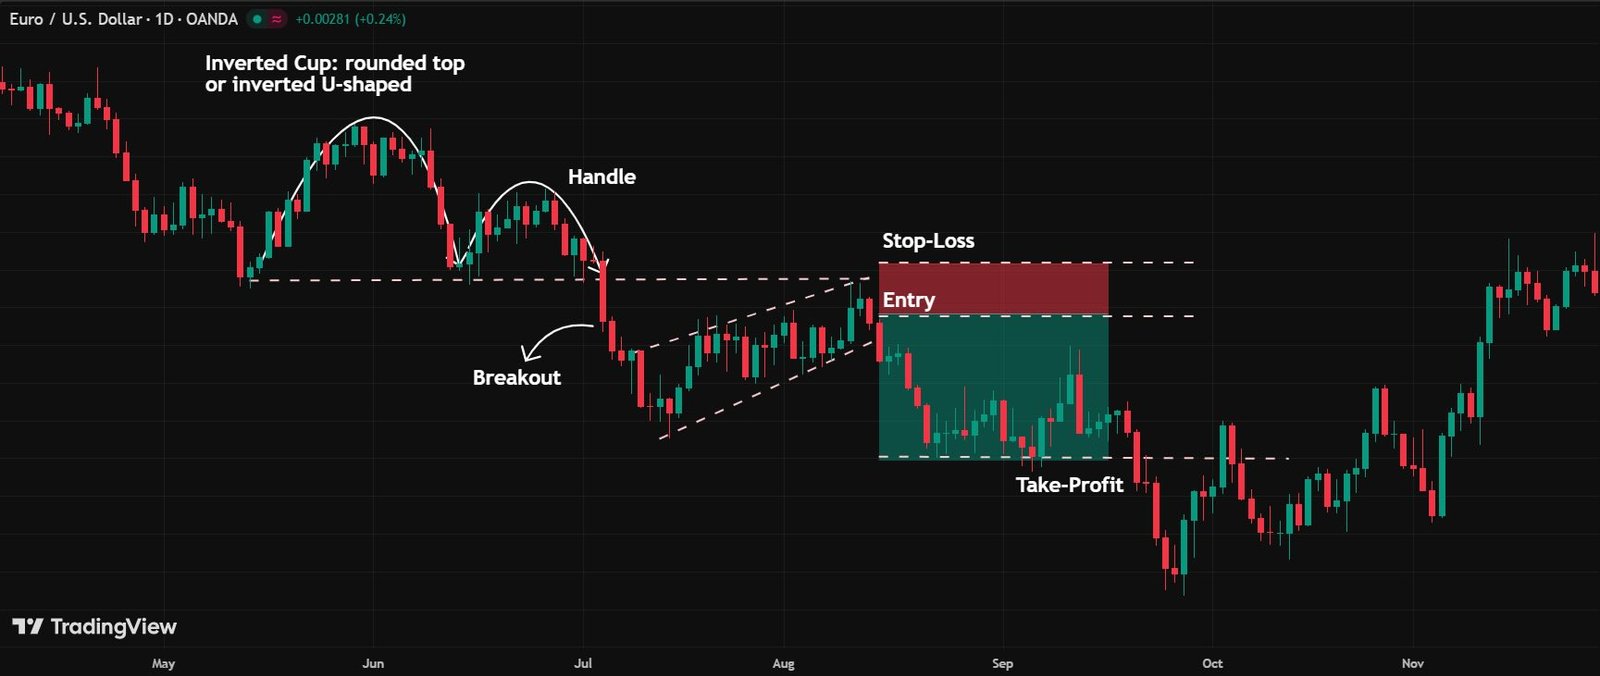
Eventually, the price broke below the support level at the base of the cup, confirming a bearish breakout. This move often triggered stronger selling pressure, and even if a slight pullback followed, it typically acted as a retest of the new resistance, signaling that the broader downtrend was likely to continue.
Based on this setup, I adjusted my trade as follows:
- I entered a short position when the price created a pullback.
- I placed my Stop-Loss order just above the neckline.
- I set my take-profit target equal to the cup’s height, projected downward from the breakout point.
Cup and Handle Pattern: Pros and Cons
Similar to other price chart patterns like the double top and bottom, the Engulfing, and others, the Cup and Handle pattern also has its own pros and cons. The main advantages and drawbacks are listed in the table below:
| Pros | Cons |
|---|---|
| Strong Bullish Signal | Challenging to Identify |
| Works Across Timeframes | Long Formation Period |
| Reliable When Volume Confirms | Not Always Perfectly Shaped |
Conclusion
By reading this guide up to this point, you’re already set to trade Cup and Handle patterns confidently. I suggest trying this pattern, or any other technical patterns we’ve covered on the CryptionHub blog, first on a demo account, and then move on to a real account once you’re comfortable.
If you found this article helpful, I’d really appreciate it if you shared your thoughts or, of course, your feedback!
FAQs
Is the cup and handle a bullish pattern?
Yes. A cup and handle is a bullish pattern that appears as a cup with a handle shape on a price chart.
What timeframe is best for the cup and handle pattern?
The cup and handle pattern works best on daily or weekly charts, as these timeframes provide more reliable signals and stronger trend confirmations.
What is the profit target in a cup and handle?
The profit target in a cup and handle pattern is typically the height of the cup added to the breakout point above the handle.


