The first time I read about technical analysis and chart patterns, I remember being bombarded with all these strange names, nothing normal, just a bunch of weird candle names that left me totally confused. But over time, I realized the trick isn’t to get stuck memorizing the names and shapes; it’s about understanding the psychology behind them. That’s the real key if you want to build a solid foundation in technical analysis. Just ask yourself: what kind of trader behavior created this candle?
That’s exactly the approach I want to take here. Instead of stressing over names, let’s dig into what they mean. In this article, I’ll focus on the tweezer top and tweezer bottom patterns. Sure, the names sound kind of funny, but what do they actually tell us? And more importantly, once you truly understand them, how can you use them in your trading?
Stick with me, because I’ll walk you through these patterns step by step—not just in theory like most articles, but with practical explanations and real examples you can learn from.
- The tweezer candlestick pattern appears as either a tweezer top or a tweezer bottom, signaling a potential market reversal.
- A tweezer top is a bearish reversal pattern that usually forms at the top of an uptrend when two or more candles share the same high.
- A tweezer bottom is a bullish reversal pattern that typically appears at the end of a downtrend when two or more candles share the same low.
- The psychology behind these patterns is that buyers (in a tweezer top) or sellers (in a tweezer bottom) attempt to push the market further but fail, leading to a reversal.
- Success with tweezer patterns depends on context analysis, risk management, backtesting, and keeping a trading journal.
Tweezer Candlestick Patterns Overview
When you hear the word tweezers, the first thing that probably comes to mind is the small tool we use to pick up, cut, or hold something. Exactly! And if I get a bit meticulous here, tweezers have two prongs that meet perfectly at the tips when you press them together.
Now, you might wonder, what does this have to do with technical analysis? Well, it’s actually the same idea on a price chart. Just like the tweezer tips line up at the same point, the candles in a tweezer top or tweezer bottom pattern align at the same high or low. Pretty neat, right?
From a technical point of view, the tweezer candlestick pattern can show up as either a tweezer top or a tweezer bottom. It usually consists of at least two candles in a row, with their highs or lows matching closely. Depending on the trend, these patterns are seen as reversal signals: a tweezer top is a bearish reversal, while a tweezer bottom is a bullish reversal.
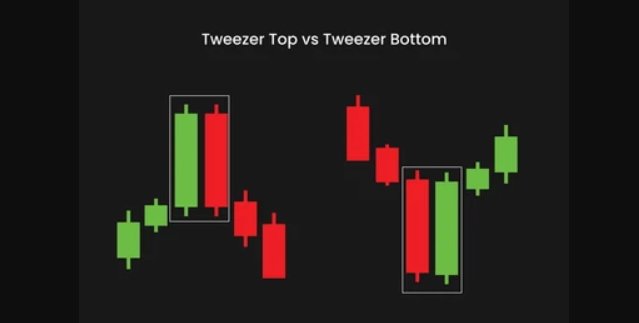
What Is the Tweezer Top Pattern?
A tweezer top candlestick pattern is a bearish reversal signal that forms when two or more candles hit the same high point. You’ll usually spot this pattern at the top of an uptrend, hinting that the market might be about to shift from bullish to bearish.
Key points about this pattern:
- The first candle is usually a bullish (green) candle.
- It’s followed by a bearish (red) candle.
- Both candles reach the same high, showing strong resistance.
- This tells us the market tried to push higher but failed.
- In short, buyers are losing strength, and sellers are likely to take control.
What Is the Tweezer Bottom Pattern?
The tweezer bottom pattern also consists of two or more candlesticks forming back-to-back, but this time they share the same low point. You’ll often see this pattern appear at the end of a downtrend, signaling that the market could be about to reverse upward.
Key points about this pattern:
- The first candle is usually a bearish (red) candle.
- It’s followed by a bullish (green) candle.
- Both candles touch the same low, showing strong support.
- This tells us the market tried to push lower several times but failed.
- In simple terms, sellers are losing strength, and buyers are starting to take control.
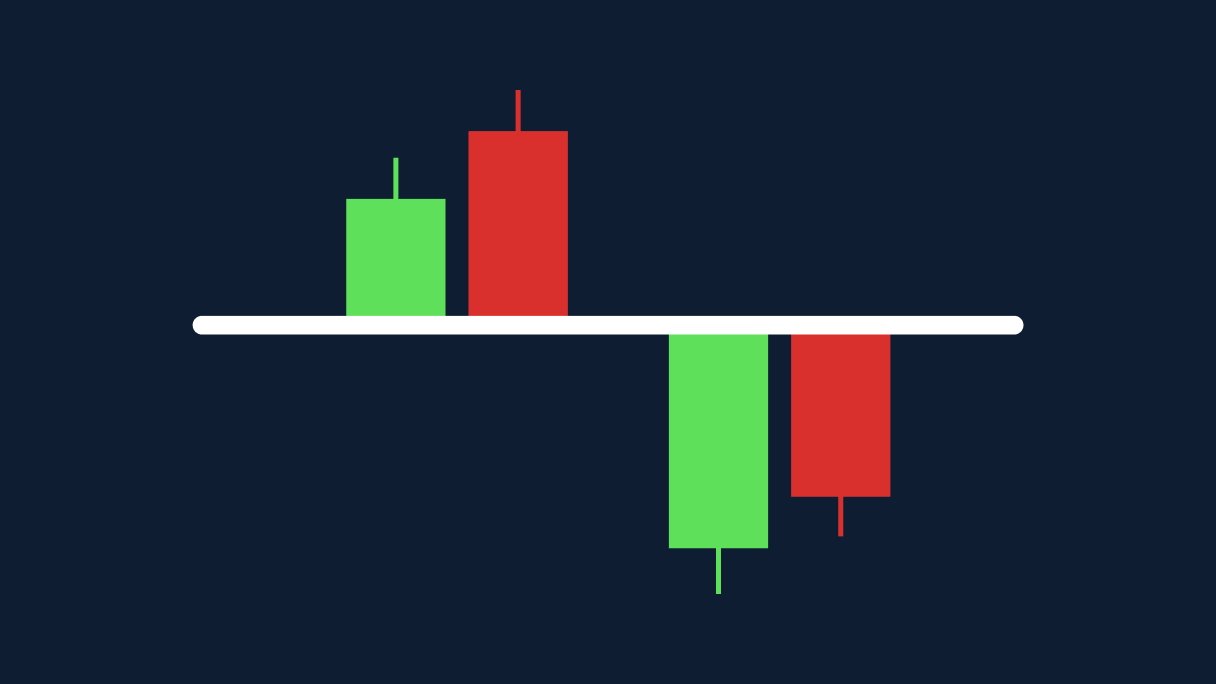
Tweezer Top Pattern vs. Tweezer Bottom Pattern
To better understand the similarities and differences between the tweezer patterns, here’s a detailed comparison:
| Candlestick Pattern | Tweezer Top | Tweezer Bottom |
|---|---|---|
| Trend Location | Appears at the top of an uptrend | Appears at the bottom of a downtrend |
| Reversal Direction | From bullish to bearish | From bearish to bullish |
| Formation | Two or more candles with the same highs | Sellers tried to push lower but failed; buyers stepped in |
| Market Psychology | Sellers tried to push higher but failed; buyers stepped in | Buyers tried to push higher but failed; sellers stepped in |
How to Trade the Tweezer Top/Bottom Patterns
So far, we’ve gone over what the tweezer top and bottom candlestick patterns are and what they signal. But I know theory alone isn’t enough; that’s why I always like to start with the basics and then move into practical, real-world examples. Think of this section as a bridge between the definition and the live examples I’ll cover next.
1- Find the Key Support or Resistance Levels
As I mentioned above, tweezers are reversal candlestick patterns. And as you know, a reversal shift commonly happens either at the top of an uptrend or the bottom of a downtrend, close to support or resistance zones. In other words, if you want to spot a tweezer candlestick, you first need to identify support and resistance levels.
- For a tweezer top pattern, look for resistance zones where selling pressure is strong enough to stop the price from moving higher.
- For a tweezer bottom pattern, look for support zones where buying pressure is strong enough to keep the price from dropping lower.
2- Identify Tweezer Top or Tweezer Bottom Pattern
Once you’ve marked the levels, here’s how to spot the actual pattern:
- Tweezer Top: The second candle is bearish, and its high matches (or nearly matches) the high of the previous bullish candle.
- Tweezer Bottom: The second candle is bullish, and its low matches (or nearly matches) the low of the previous bearish candle.
When you see this setup near support or resistance, congrats! You’ve got a tweezer pattern.
3- Confirm the Pattern
If someone tells you that any reversal candlestick pattern, whether it’s a tweezer top or a tweezer bottom, always signals a market shift, they’re lying. Nothing in the market is guaranteed. But hey, that doesn’t mean you should panic. There are confirmations you can look for that will help you decide whether to trust the pattern or not.
For example, if you spot a tweezer bottom candlestick, you can double-check it with other reversal indicators, reversal patterns like the Head and Shoulders pattern, or even candlesticks such as the engulfing pattern that I’ve covered before.
By waiting for confirmations, you give yourself more confidence that the move is genuine and not just a fake-out.
4- Identify Entry Points
After recognizing the tweezer top and bottom patterns and checking for confirmations, you can decide whether to go for a long or short position. A quick tip: always plan your exit point as well. Entering a position is only a small part of a solid trading strategy. Without a plan for getting out, you’re basically flying blind.
5- Adjust Stop-Loss and Take-Profit Orders
Even if you spot patterns and confirmations correctly, the market can still be unpredictable. That’s why having a risk management plan is the key. And trust me, with a stop-loss in place, you don’t need to lose sleep over sudden market swings.
- For a tweezer top pattern, place your stop-loss just above the high of the candles.
- For a tweezer bottom pattern, place your stop-loss just below the low of the candles.
And remember how I mentioned planning your exit earlier? That’s where take-profit orders come in. Stop-loss orders protect you from big losses, while take-profit orders make sure you lock in profits before the market changes direction.
Good places to set take-profit orders include:
- Strong support or resistance zones
- Moving averages
- Fibonacci retracement levels
Well, now I’ve covered all the basics and rules you need to know. It’s time to take the next step and see how these patterns actually play out on a price chart. In the following sections, I’ll walk you through a practical example, so stick around! You don’t want to miss the real scenarios below.
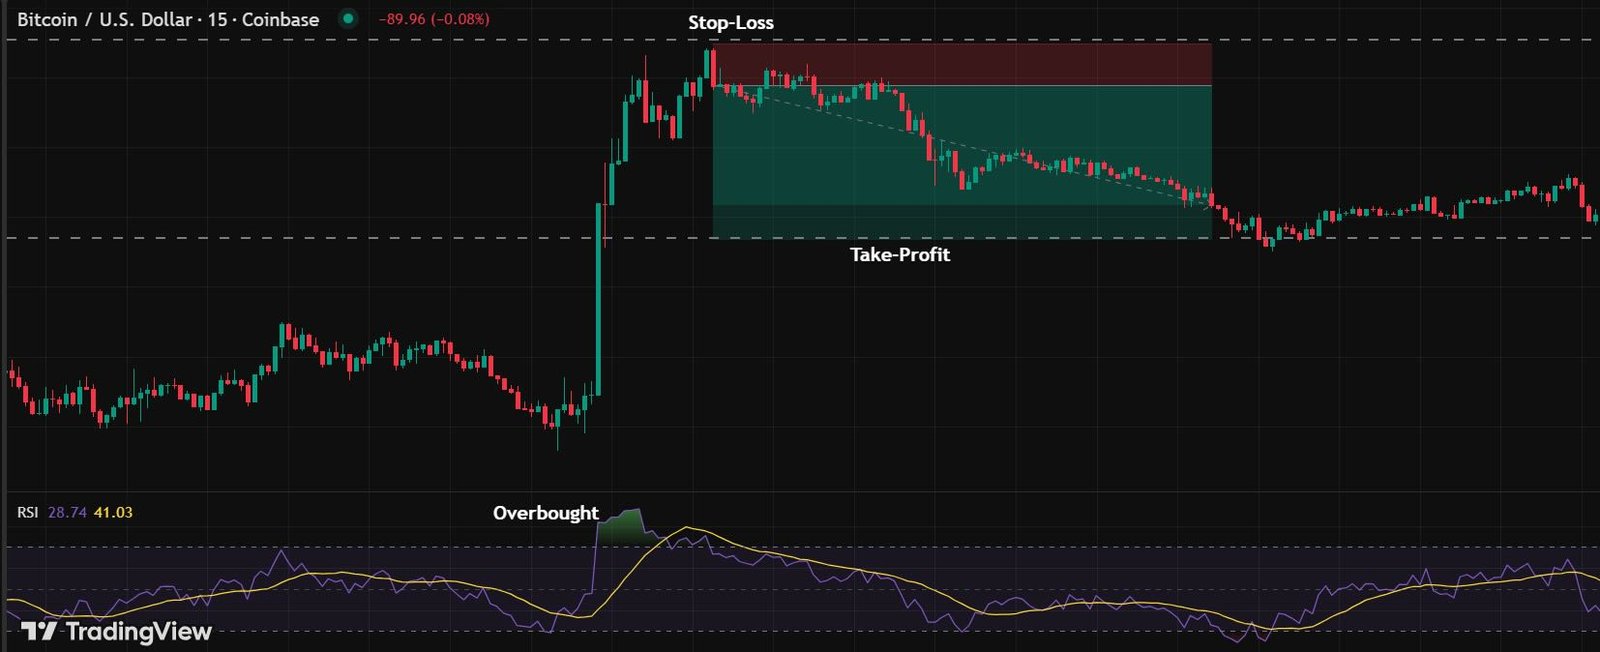
Tweezer Top Pattern Real Example
As you can see in the picture below, I was looking for a Tweezer Top pattern. Based on what I explained earlier, I first checked the overall trend; it was an uptrend, with the price making higher highs again and again. But soon, buyer pressure started to fade, the uptrend got weaker, and a resistance zone formed.
At the very top of this uptrend, two candles appeared with the same highs. By spotting this candlestick pattern, I considered that the market might shift into a bearish trend. To confirm it, I also used another reversal tool: the RSI, which showed an overbought condition, another hint of a possible reversal.

Based on this setup, if you want to open a short position, here’s how you could manage it:
- Enter a short position once the second bearish candle in the Tweezer Top pattern is closed.
- Place your stop-loss just above the tweezer highs.
- Place your take-profit near the recent swing lows.
Tweezer Bottom Pattern Example
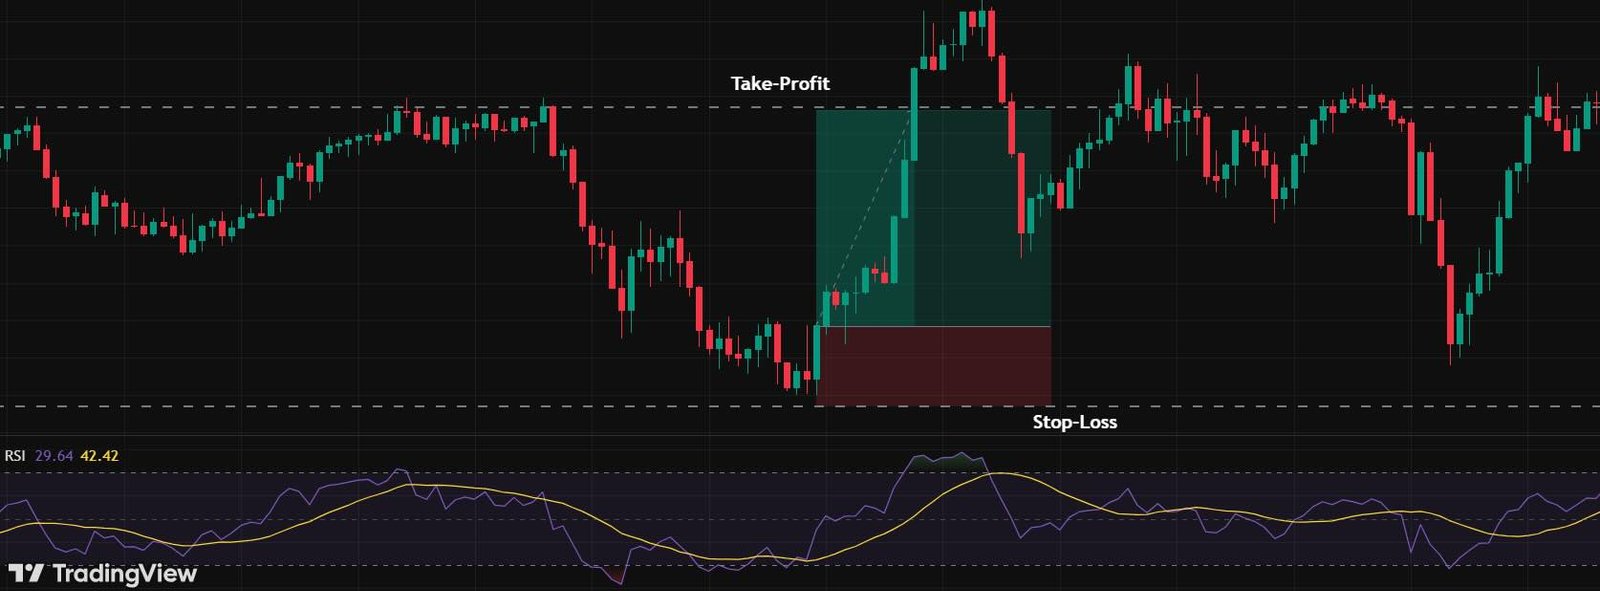
Now let’s flip the scenario. Here, I was looking for a Tweezer Bottom pattern. This time, there was a downtrend. At the end of this move, two candles formed with the same lows. I considered this a potential signal for a bullish reversal.
But just to be more confident, I checked the RSI indicator again. It showed a bullish divergence, and alongside that, I spotted a bullish engulfing candle, both confirming the setup.
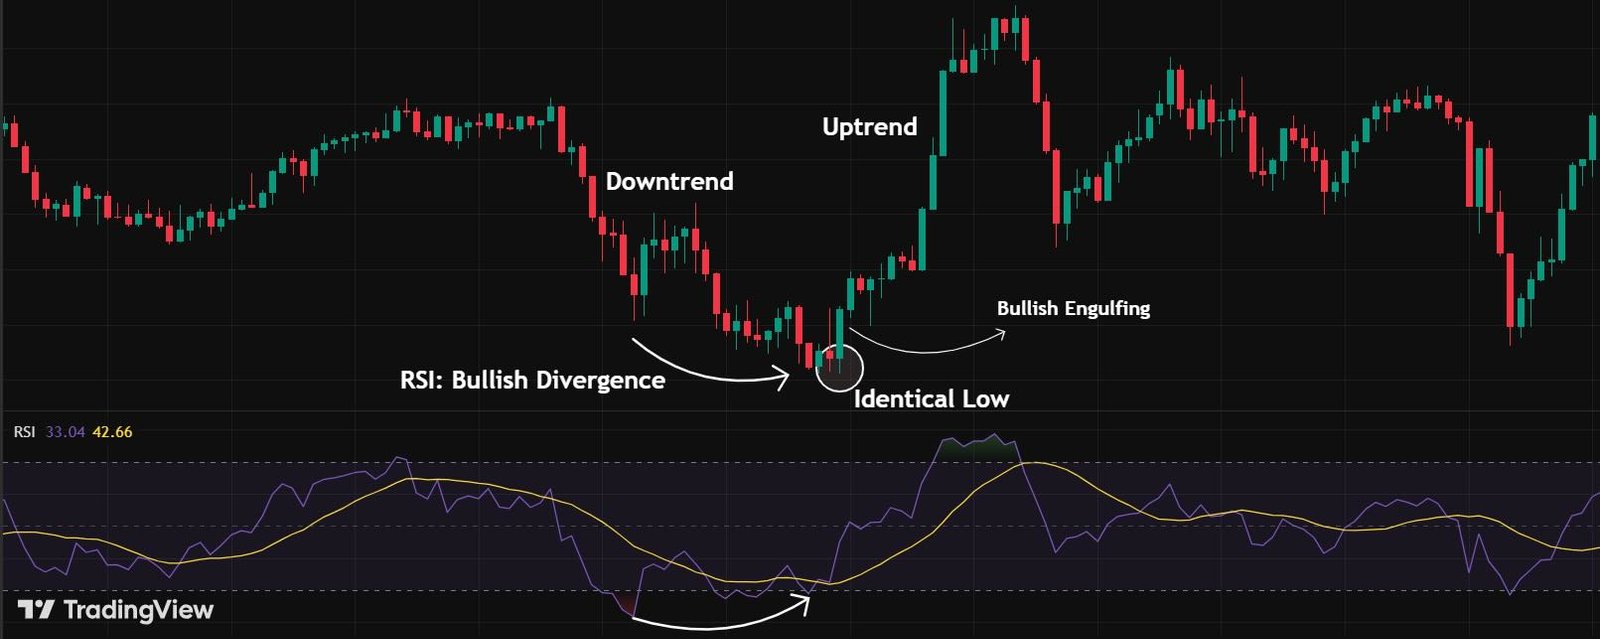
Based on this setup, if you want to open a long position, here’s how you could manage it:
- Enter a long position once the second bullish candle in the Tweezer Bottom pattern is closed. (After checking confirmation)
- Place your stop-loss just below the tweezer lows.
- Place your take-profit near the recent swing highs.
Are Tweezer Top and Bottom Patterns Good for Binary Options Trading?
Overall, Tweezer Top and Tweezer Bottom are short-term candlestick reversal patterns, which makes them especially useful for traders who focus on quick market moves. If you’re a binary options trader, you can also take advantage of these patterns, particularly if you prefer ultra-short or short time frames.
When using this pattern for binary options trading, you can work with top brokers like Pocket Option and Quotex. The main concept of trading with these patterns is exactly the same as in the real examples I explained above. Just remember one golden rule: don’t put all your eggs in one basket. Always try to combine tweezers with other tools or indicators to confirm the setup and improve your chances.
For those of you who like automated trading, you can check out our article “Everything to Know about Binary Options Trading Bots in 2025”, where we explain how trading bots can support you in making smarter binary options trades.
Tweezer Top & Bottom Patterns: Advantages and Disadvantages
Just like other candlestick patterns, Tweezer Top and Tweezer Bottom candles also have their own limitations along with their advantages. No pattern is perfect, and tweezers are no exception. Here’s what you need to know about the Tweezer candlestick pattern:
| Pros | Cons |
|---|---|
| Simple to Identify | High False Signal Rate |
| Useful with Other Indicators | Short-Term Nature |
| Adaptable Across Different Assets | Needs Confirmation |
Tweezer Top and Tweezer Bottom Patterns: Top Tips
By now, you already know what the Tweezer Top and Bottom candles are and how they work. From my own experience, and from what I’ve seen in successful traders, following the tips below can help you achieve much better results:
Identify Market Context First
It’s not just about spotting two candles with identical lows or highs and thinking: “That’s it.” First, you need to understand the overall market trend. That’s why you should always start by checking the bigger picture before looking for these patterns.
Use Reversal Indicators and Patterns
As I’ve already mentioned, relying only on candlesticks is not enough, and you may need to wait for more confirmation. To do this, you can use other reversal patterns and indicators. In the context of candlestick patterns, you can use Dragonfly Doji, Shooting Star, Gravestone Doji, Hammer and etc, as they all show a sign for reversal.
Follow Risk Management Tips
If you search online, you’ll find thousands of stories about traders with great skills who still ended up with empty accounts, all because of poor risk management. The difference between real traders and the rest is managing risk. Tips like using stop-loss and take-profit orders, and never risking more than 1–2% of your account on a single trade, are what keep you in the game. (In short, don’t bet the farm on one setup.)
Backtest your Strategy
Always remember to backtest and improve your strategy over time. Backtesting helps you figure out the best times for you to trade, which markets suit your style, and how your strategy performs in different conditions.
Develop a Trading Journal
Last but not least, learn from your mistakes and avoid repeating them. A trading journal is your best friend here. By keeping track of your trades, you can analyze what worked, spot weaknesses, build on your strengths, and steadily improve.
Conclusion
That’s all about the Tweezer Top and Tweezer Bottom candlestick patterns. I hope this article, along with the real examples, helped you understand them more clearly and gave you some useful insights for your trading journey.
If you’d like to go deeper, make sure to check out our other articles on the Crypoption Hub blog. We explore different candlestick patterns and technical tools that can help you take your trading skills to the next level. Definitely worth your time.
FAQ
What does a tweezer top indicate?
Tweezer top signals a bearish reversal at the top of an uptrend, showing buyers are losing strength.
How do you find the tweezer top patterns?
Look near resistance zones for two candles with matching highs, the first bullish and the second bearish.
What is a tweezer bottom?
Tweezer bottom is a bullish reversal at the end of a downtrend, where two candles share the same low.
What is the psychology behind the tweezer top and bottom?
In a tweezer top, buyers fail to push higher, and sellers take control; in a tweezer bottom, sellers fail to push lower, and buyers step in.


