In trading, there’s a popular saying: “The trend is your friend.” Basically, the stronger the trend, the more profit you can potentially make. It’s also generally advised to avoid trading in range-bound markets, where price movements are less predictable. The question that might be left is this: How can you actually identify a trend versus a consolidation phase?
Well, the answer lies in technical tools like the Aroon indicator. If you’re curious about how to use the Aroon indicator and how to read it effectively, stick with me. This article will answer all your questions and more.
- The Aroon Indicator helps identify trends, strength, and potential reversals using two lines: Aroon Up and Aroon Down.
- When Aroon Up is above Aroon Down (especially over 70), it signals an uptrend; the opposite indicates a downtrend.
- Crossover signals between the two lines can suggest trend reversals and potential entry points.
- Periods where both lines stay close together usually signal a consolidation phase or range-bound market.
- You can use the Aroon Indicator on platforms like TradingView, MT4, and Pocket Option by adjusting period settings to fit your strategy.
- 14 periods is the most commonly used setting, but this can be changed depending on the asset and timeframe.
- Always combine the Aroon Indicator with price action, patterns, or other tools for stronger confirmation.
What Is the Aroon Indicator?
The Aroon indicator is made up of two components: the Aroon Up and Aroon Down. Together, they form the full Aroon indicator. Whether you’re trading in the forex market or dealing with financial derivatives like binary options, this indicator helps you identify whether the market is in an uptrend, a downtrend, or a consolidation phase, where the market lacks a clear trend.
The Aroon indicator appears on the chart as two lines, ranging from 0 to 100. That’s the foundation of this handy tool. Keep scrolling as I dive deeper into how to read the Aroon indicator, with real examples on different platforms!
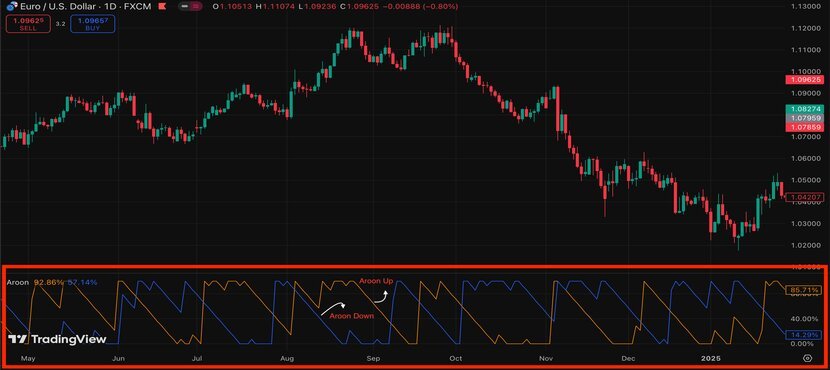
While you’re here, don’t miss our latest article about “the Accelerator Indicator”.
How Does the Aroon Indicator Work?
Reading and understanding the Aroon indicator isn’t really that complex. It’s a great tool for identifying trends, measuring the strength of those trends, spotting reversals, and helping you find the right entry and exit points by showing the highest and lowest prices over a set period.
As mentioned earlier, the Aroon indicator consists of two separate lines. To determine if the market is in an uptrend or downtrend, just focus on these two lines, and I’ll explain how:
- Uptrend: If the Aroon Up line is above the Aroon Down line (especially if it’s above 70), it signals that the market is in an uptrend. The higher the Aroon Up line, the stronger the uptrend. It’s a pretty solid sign that things are heading upward.
- Downtrend: On the flip side, to spot a downtrend, if the Aroon Down line is above the Aroon Up line (especially above 70), it means the market is in a downtrend. The higher the Aroon Down line, the stronger the downtrend.

But the Aroon indicator isn’t just about spotting ongoing trends, which we can also do with some other tools, such as the ADX indicator. What makes the Aroon indicator unique is that it can also help you predict reversals:
- If the Aroon Up line crosses above the Aroon Down line, you might consider it a buy signal, indicating the start of a new uptrend.
- On the other hand, if the Aroon Down line crosses above the Aroon Up line, it’s a sell signal, suggesting the start of a new downtrend.
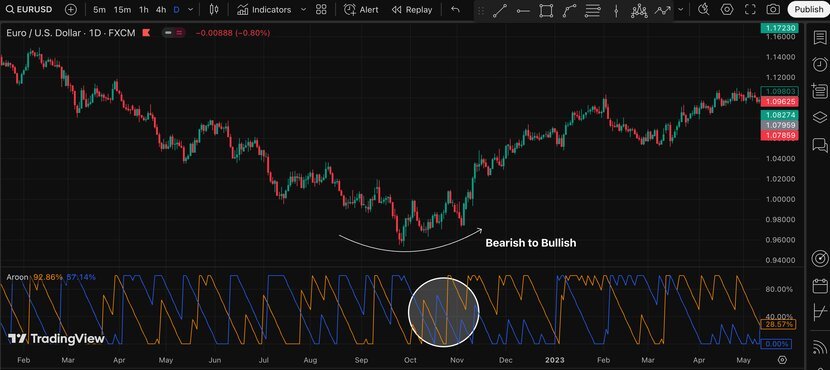
Now, one last thing to consider: What if the market isn’t in an uptrend or downtrend, and you’re stuck in a sideways situation?
- When both the Aroon Up and Aroon Down remain close together, you can consider it as the price ranges and doesn’t have a clear trend. This is when the price moves sideways, and it’s challenging to predict a trend.
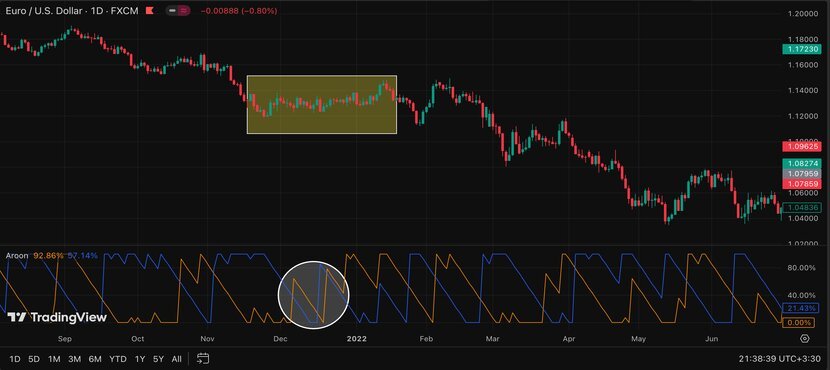
Read More: The Supertrend Indicator is another useful indicator that helps you in trading. Use it along with the Aroon indicator and feel the magic.
Aroon Indicator Formula
The Aroon Indicator shows how long it’s been since a security or index hit its most recent high or low. You don’t need to calculate this yourself, but here’s the Aroon indicator formula if you’re curious:
{(Number of periods − Number of periods since highest high) / Number of periods} × 100
Aroon Down:
{(Number of periods − Number of periods since lowest low) / Number of periods} × 100
In this formula, you need to know:
- Days since highest high is the number of days since the highest price in the last N periods.
- Days since lowest low is the number of days since the lowest price in the last N periods.
I know this might look confusing, but don’t worry! The Aroon Indicator shows these numbers on a chart as two lines, which makes it easier to understand. I’ll explain how to read these lines in the next section, but first, let’s go through a simple example:
Let’s say you’re looking at a 14-day period, and you have the following data:
- The highest price in the last 14 days was 5 days ago.
- The lowest price in the last 14 days was 8 days ago.
Now, let’s calculate the Aroon Up and Aroon Down:
Aroon Up: {(14 – 5) / 14} * 100 = 64.29
Aroon Down: {(14 – 8) / 14} * 100 = 42.86
So, here’s what this means:
- Aroon Up = 64.29: This shows a moderate uptrend.
- Aroon Down = 42.86: This shows a weaker downtrend.
This tells us that the market is going up a bit stronger than it’s going down. On a chart, these numbers are shown as lines that are either above or below each other, making it easier to see the trend.
Read More: All about the “Zig Zag Indicator“
How to Read the Aroon Indicator in TradingView
To use the Aroon indicator on platforms like TradingView, just search for it in the indicator menu. As shown in the image below, click “Aroon.”
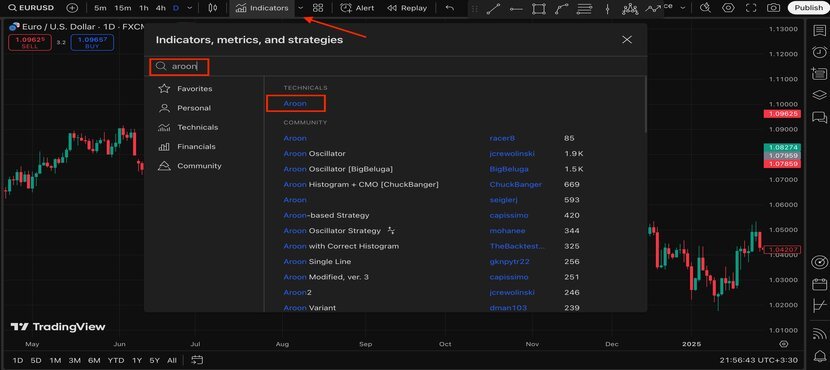
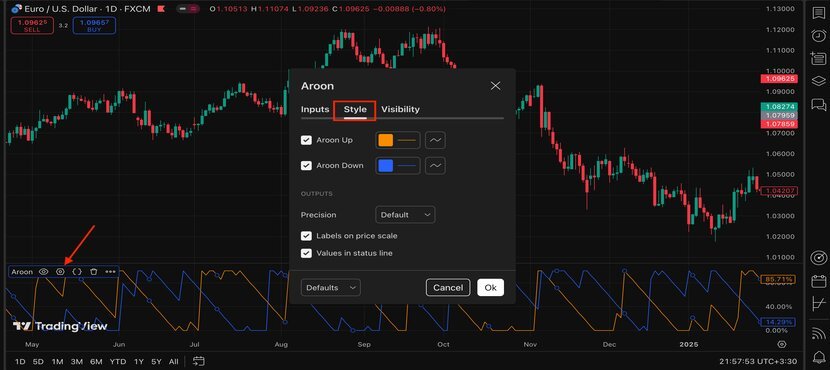
By default, the Aroon Up is orange, and the Aroon Down is blue, but you can change these colors if you like. To do this, click on one of the Aroon lines, and a small window will pop up. From there, click the settings icon. You can change the colors in the “Style” section.
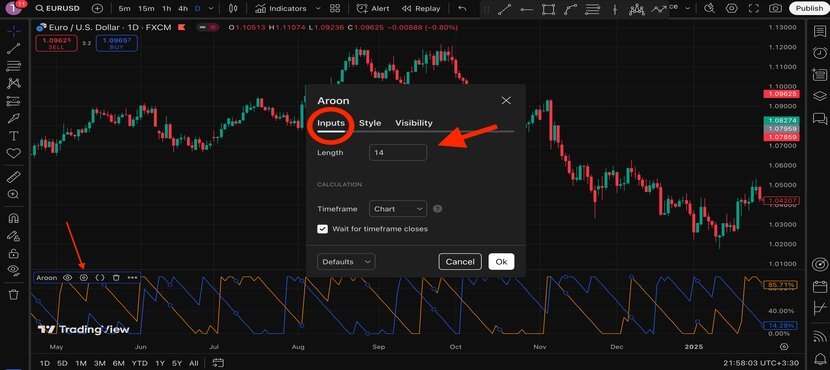
In the earlier example for the Aroon Indicator formula, I used a 14-day period. You can change the period in the “Inputs” section. For example, if you set it to 30 on a daily chart, it will show the highest and lowest prices over the past 30 days.
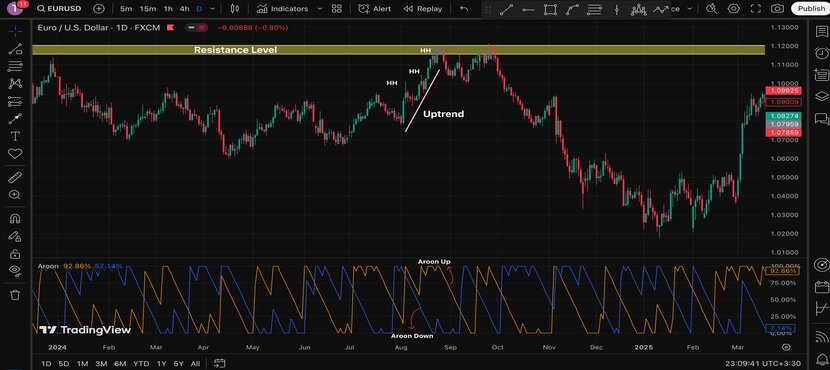
Now that you know the basics of the Aroon indicator, let’s dive a bit deeper into how to read it on TradingView. Remember how I said that if the Aroon Up is above and the Aroon Down is below, it means the market is in an uptrend? Well, check out the chart below. You’ll see a clear uptrend, with the Aroon Up close to 100.
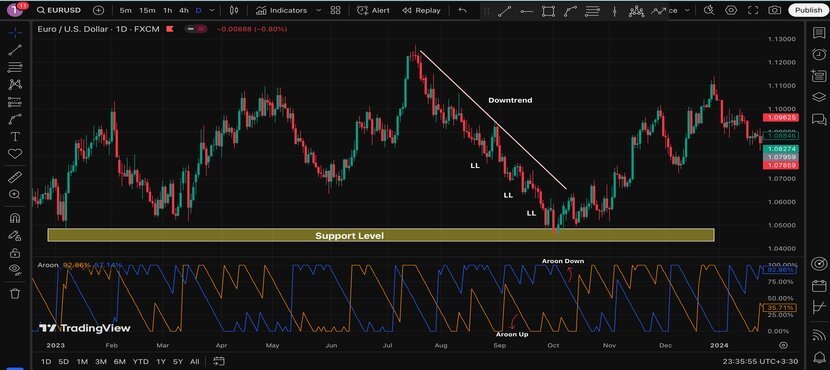
This also works for downtrends. In the image below, the Aroon Down line is near 100, with a big gap between the two lines, showing a strong downtrend.
I also talked about trend reversals and how to spot them. In the example below, you’ll see the Aroon crossover strategy in action. As I mentioned, when the Aroon Up crosses over the Aroon Down, it can signal a reversal, often pointing to an uptrend. As you can see below, just after the crossover, the reversal happens.
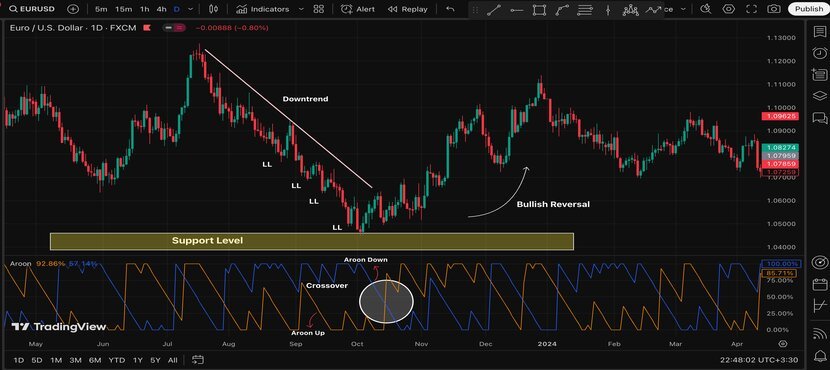
That’s how you can read the Aroon indicator and use it to spot trends and reversals! I also recommend that you limit your activities to certain time periods that we’ve discussed here in our guide on the best times to trade binary options.
How to Use the Aroon Indicator in MT4
If you’re using MetaTrader 4 (MT4) and can’t find the Aroon Indicator, don’t worry! Here’s how you can set it:
- Download the Aroon Indicator: First, you need to download the Aroon Indicator. You can find it on websites like Forex Station or TradingFinder.
- Open MT4: After downloading, open the MT4 platform and click on “File” in the top menu.
- Open the Data Folder: Click “Open Data Folder,” then go to the MQL4 folder.
- Add the Indicator File: In the MQL4 folder, find the “Indicators” folder and place the downloaded Aroon indicator file there.
- Restart MT4: Close MT4 and reopen it to make sure it can read the new indicator.
- Add the Indicator: Now, click “Insert” in the top menu, then go to “Indicators” > “Custom,” and you should see “Aroon” listed there.
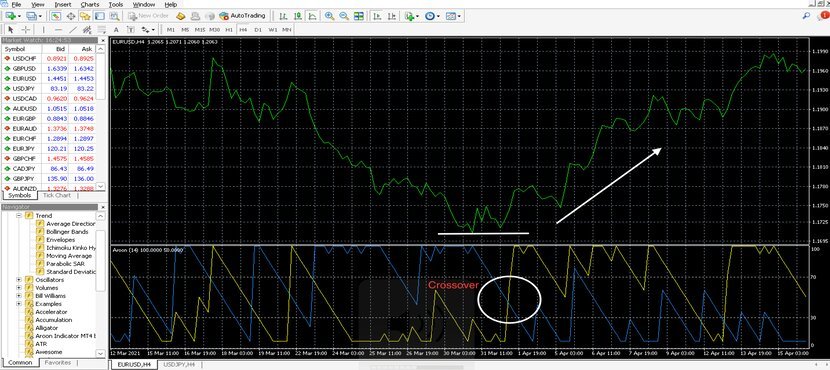
And that’s it! You’re all set to use the Aroon Indicator on MT4, just like on TradingView. Take a look at the image below to see how the reversal forms after the crossover, this time on MT4.
Easy, right? Enjoy using the Aroon Indicator!
How to Use the Aroon Indicator in the Pocket Option
If you’re into binary options trading, you can also use the Aroon Indicator on a popular platform like Pocket Option. The way the Aroon works on this platform is the same as I explained earlier on other platforms. To add it, just click on the indicator menu and search for “Aroon.”
On Pocket Option, the default colors for the Aroon Up and Aroon Down might be different. For example, mine are blue for Aroon Up and red for Aroon Down. You can change these colors by clicking on the pencil icon and adjusting them to your preference.
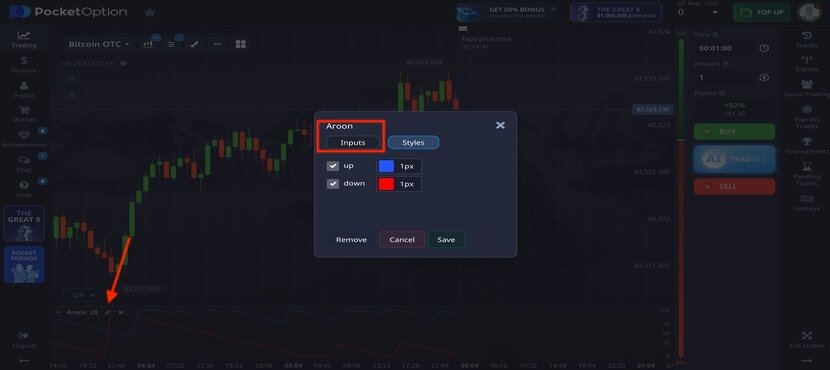
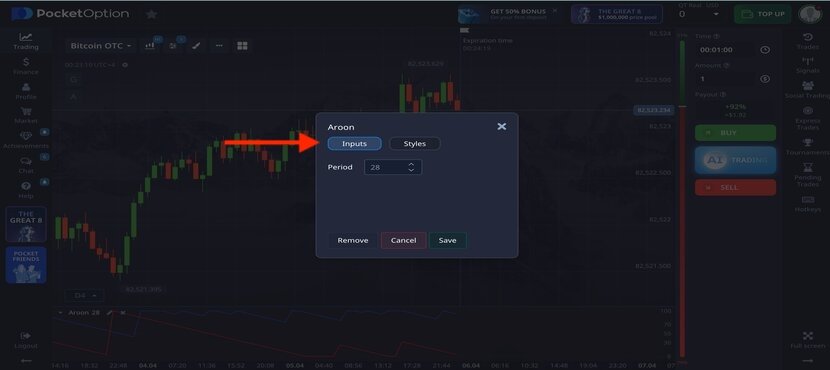
If you’re trading across multiple timeframes and want to use the Aroon Indicator on different platforms, you can also adjust the period. To do this, click on the settings icon, choose “Inputs,” and then enter your preferred period, just like I show in the image below.
Read More: Explore other powerful tools for trading binary options in our article, “The Best Indicators for Binary Options Trading”.
What Are the Best Aroon Indicator Settings?
So far, I’ve done my best to explain what the Aroon indicator is and break down the Aroon indicator strategy across different platforms. As you know, traders follow various strategies on different timeframes, and one important factor to consider is the period length, which you can change in the Aroon indicator settings.
The best Aroon Indicator settings really depend on your trading strategy and the type of asset you’re trading. What works for one trader might not work for another. However, the most common setting is 14 periods.
To clarify, “14 periods” changes based on your timeframe. For example, on a daily chart, the 14 periods mean 14 previous daily candles. On a monthly chart, it means 14 previous months.
Top Tips When Trading with the Aroon Indicator
Now that you know how to use the Aroon Indicator on different platforms like TradingView, MT4, and Pocket Option, reading the indicator is the same on all of them. Just apply the indicator on any platform you like.
But remember these tips when trading with the Aroon Indicator:
- The Aroon Indicator is just a tool. Sometimes, you’ll need to use more than one tool to find the right entry and exit points. For this purpose, you can use various candlestick patterns, such as the Engulfing, Tweezer top and bottom, Hammer, Head and Shoulders, and others.
- When trading binary options, always check for valid price action or chart patterns to confirm your signals.
- Never risk more than you can afford. Even with advanced knowledge, always use proper position sizing.
- Stick to your trading strategy and use risk management tools.
Conclusion
That’s all about the Aroon indicator. I’ve shared everything I know about this technical tool. After reading this article, you now have a solid understanding of how to use the Aroon indicator and apply it in your trading.
Don’t forget to check out our other articles on the CrypoptionHub blog. They can help you improve your trading results.
If you have any questions about this indicator, just leave a comment, and we’ll answer as soon as we can. Thanks for reading!


