Some indicators help you spot trends, others catch reversals, and a few can do both. The Vortex indicator is one of those tools that not only helps you ride the trend but also gives you a heads-up when a reversal might be coming. In this article, I’m gonna break down what the Vortex indicator is, the best settings to use, a common vortex indicator strategy you can follow, and how it stands out from tools like the DMI indicator.
- The Vortex indicator helps both confirm existing trends and identify potential trend reversals by tracking two lines, +V and -V, that signal bullish or bearish momentum.
- You can watch for the crossover of +V and -V lines to spot trend changes; a +V crossing above -V signals a bullish reversal, and vice versa for bearish reversals.
- The distance between the +V and -V lines indicates trend strength, a wider gap means a stronger trend.
- The Vortex indicator works best when used alongside other indicators to filter out false signals and improve the reliability
What Is the Vortex Indicator?
The Vortex indicator was introduced in 2010 by Etienne Botes and Douglas Siepman in an article for Technical Analysis of Stocks & Commodities magazine. Compared to other technical indicators like moving averages, it’s a newer concept. But don’t worry, it’s not complicated and is really super easy to use.
The Vortex indicator is made up of two lines, and you can use it to confirm the current trend, measure the strength and also spot when a trend might change its direction. Simple as that! Now, follow me to the next section as I explained exactly how it works.
How Does the Vortex Indicator Work?
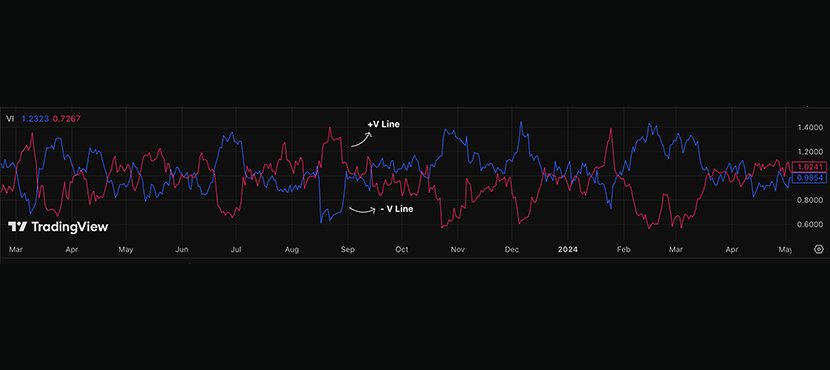
Put simply, when you add the Vortex indicator to your chart, you’ll see two lines: +V (positive V) and -V (negative V). In most cases, they show up as blue and red or green and red, but the colors might be different depending on your platform.
Now, you can use the Vortex indicator for a few key things. Let’s break them down:
1. Trend Confirmation: When the +V line is above the -V line, it confirms an uptrend. You can also use other tools to double-check this, like the Aroon indicator or the Zigzag. On the flip side, when the -V line is above the +V line, that signals a downtrend.
2. Trend Strength: Another use of this indicator is measuring how strong a trend is. Just look at the distance between the two lines; the wider the gap, the stronger the trend.
3. Trend Reversals: Some traders follow the trend, while others, like me, prefer spotting reversals and jumping in early. If you’re in that second group, the Vortex can help a lot. When the +V line crosses above the -V line, it might signal a bullish reversal, and when the -V line crosses above the +V line, that could mean a bearish reversal is coming.
If you’re interested in other, less popular, but simple-to-use indicators like the Vortex, check out our guide on the Donchian Channels indicator.
Vortex Indicator Best Settings
Now that you know the basics, you might be wondering what the best settings are for the Vortex indicator. From my own experience, there’s really no one-size-fits-all in trading, especially when it comes to trading strategies.
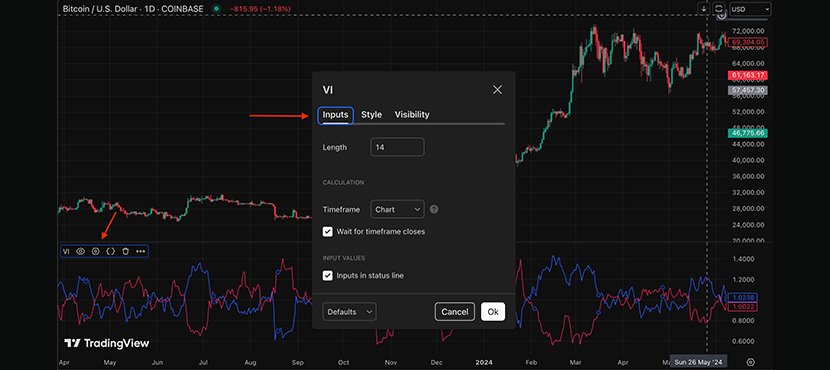
Like most indicators, the Vortex lets you change the settings based on how you trade. The default setting is 14, which gives a good balance: it reacts quickly enough without too much noise
If you like getting more signals, you can try shorter settings like 7 or 10.
But if your strategy comes with longer timeframes, go for something like 20, 25, or even 30. These higher numbers help smooth things out and give fewer, more stable signals.
How to Use the Vortex Indicator on MT4
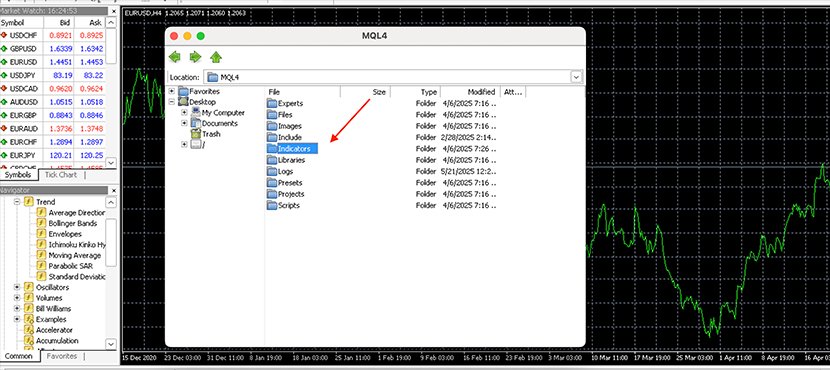
If you’re using a trading platform like MT4 (MetaTrader 4), you might’ve searched for the Vortex indicator and couldn’t find it. That’s because MT4 doesn’t come with it by default. But don’t worry! Adding it is really easy. I did it too, and here’s how:
- First, download the Vortex indicator from a trusted site like indicatorspot.com.
- Then, go to your MT4 platform and click File at the top, then choose Open Data Folder.
- In the folder that opens, go to MQL4, then open the Indicators folder.
- Now, just copy the downloaded Vortex file into that folder.
- Close and reopen MT4. You’ll now see the Vortex indicator in the list, just drag it onto your chart and start using it like I explained earlier.
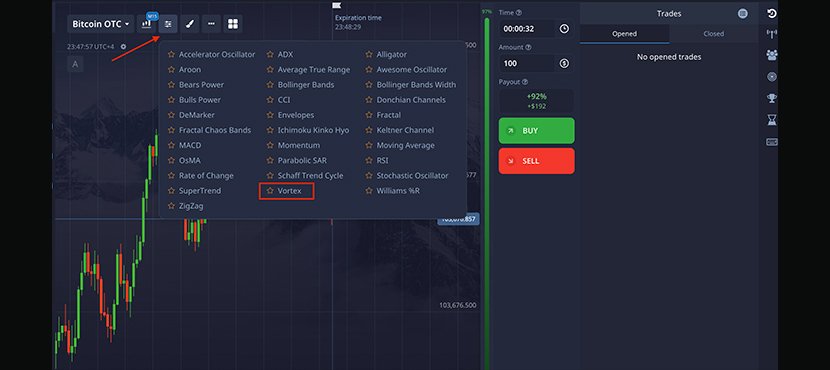
Vortex Technical Indicator on PocketOption
If you’re into options trading, you can also use the Vortex indicator on platforms like PocketOption. It’s super easy: just open the indicators menu, choose Vortex, and you’re good to go. From there, you can trade using the tips I shared earlier.
Vortex Indicator Strategy: Practical Example
Alright, so far I’ve explained what the Vortex indicator is and how it works. I know it might still feel a bit confusing. That’s why I want to walk you through a simple Vortex indicator strategy to help you see it in action.
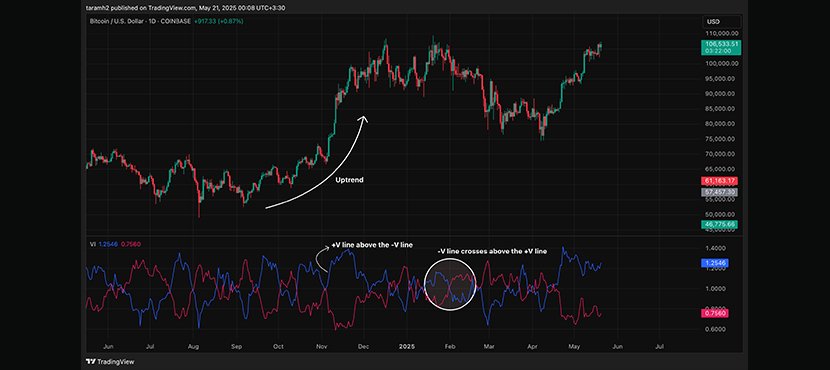
Check out the image below: it’s a chart of my absolute favorite asset: Bitcoin. At first, there’s a strong uptrend. The price keeps rising, and the Vortex indicator confirms this because the +V line stays above the -V line.
Then, the price hits a resistance level, it stops making higher highs, and the momentum starts to fade. At this point, a few things could happen: the price might consolidate, break above the resistance, or reverse.
In this case, you can see the -V line crosses above the +V line; that’s our reversal signal. Right after that, the price drops to the previous swing low.
Pro Tips for Trading with the Vortex Indicator
By now, you probably have a good idea of how the Vortex indicator works. But to get better results when using it, here are a few helpful tips that can really make a difference:
- Combine with Other Indicators and Methods: Use the Vortex along with other tools like the Accelerator Oscillator or other momentum indicators to confirm signals. You can also use other concepts, like the hammer candlestick pattern or patterns like symmetrical triangles, for entries.
- Pick the Right Lookback Period: As I mentioned earlier, there’s no vortex indicator best settings. The default is 14, which works fine for many traders. But if you’re trading on shorter timeframes, go with something like 7 to 10. For longer-term trading, you can also try 21 to 30, which helps reduce noise.
- Use Smart Stop-Loss and Take-Profit Levels: Markets can move fast, so always use stop-loss and take-profit orders. Good risk management can really boost your results.
- Backtest Before Going Live: Even though the Vortex indicator is easy to use, don’t skip the practice. You know? Practice really makes perfect! Try the vortex indicator on a demo account first and make sure your strategy is solid before risking real money.
Vortex Indicator vs DMI Indicator
The Vortex indicator may look similar to the DMI in some ways, like showing the strength and direction of a trend. Here’s a quick look at how the Vortex and DMI compare. Also, if you want to learn more about the DMI, check out our article “DMI Indicator Explained.”
| Feature | Vortex Indicator | DMI Indicator |
|---|---|---|
| Use cases | Best for spotting trend reversals and trend confirmation. | Useful for determining if the market is trending or ranging and the strength of that trend over various timeframes. |
| Components | Two lines: +V and -V lines | Three lines: +D, -D and the ADX line |
| Default Settings | 14-period | 14-period |
| Limitations | It may give false signals in very volatile or sideways markets. | Can be lagging and may not react quickly to short-term price action. |
Final Thoughts on Vortex Indicator
Well, that’s all about the Vortex indicator, a technical indicator that helps confirm trends, spot how strong a trend is, and even catch possible reversals. Like other indicators, it has its own pros and cons, which are listed below:
| Pros | Cons |
|---|---|
| Easy to use | May give false signals |
| Works on multiple timeframes | No overbought/oversold information |
| Complementary to other indicators | Needs confirmation |


