When you first start with technical analysis, looking at charts and trying to understand price moves can feel impossible. The trick, though, is simply spotting patterns that have shown up again and again over time, and learning what they mean. Since these patterns often repeat, once you recognize them, you’ll know what to expect next.
One useful pattern to keep an eye on is the engulfing candle patterns. So, what is an Engulfing pattern exactly? What does it look like, and how can you actually trade using it? In this article, I’ll break it all down for you in plain language, with clear explanations and real chart examples. No fluff, just the good stuff.
- An engulfing pattern happens when a large candle fully covers the previous one, signaling a possible market reversal.
- A bullish engulfing candle forms at the bottom of a downtrend, completely covering the previous candle and signaling a potential reversal.
- A bearish engulfing candle appears at the top of an uptrend and often signals a reversal to the downside.
- To trade a bullish engulfing setup, enter after the candle closes, set a stop-loss below its low, and aim take-profit near resistance or swing highs.
- In a bearish engulfing setup, traders enter short after the pattern, place stop-loss above the candle, and target previous support or swing lows.
- Engulfing candles can be combined with indicators like RSI to strengthen confirmation of trend reversals.
What Is An Engulfing Candle?
In technical analysis, there are different patterns; some show that a trend will likely continue, while others warn that a trend might turn around. The Engulfing pattern falls into the reversal group, and it comes in two forms: the bullish engulfing candle and the bearish engulfing candle.
To understand the engulfing candle’s meaning, let’s first look at the word engulf. It basically means to surround and cover something completely. That’s exactly what happens on a price chart. We say a candle is engulfing when one candle completely covers its previous candle. In other words, it hides the candle that came before it.
Now, let’s break down the difference between a bullish and a bearish engulfing pattern in the next section.
Bullish Engulfing Candle
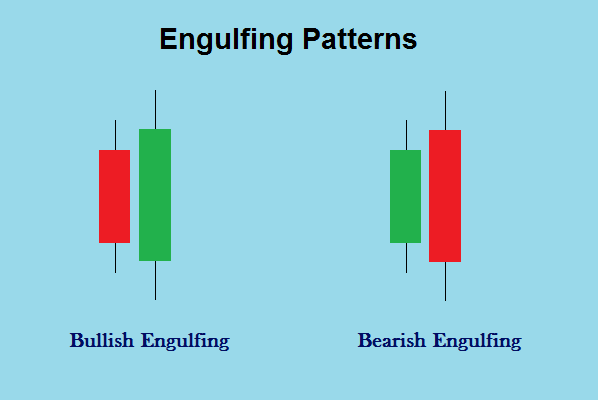
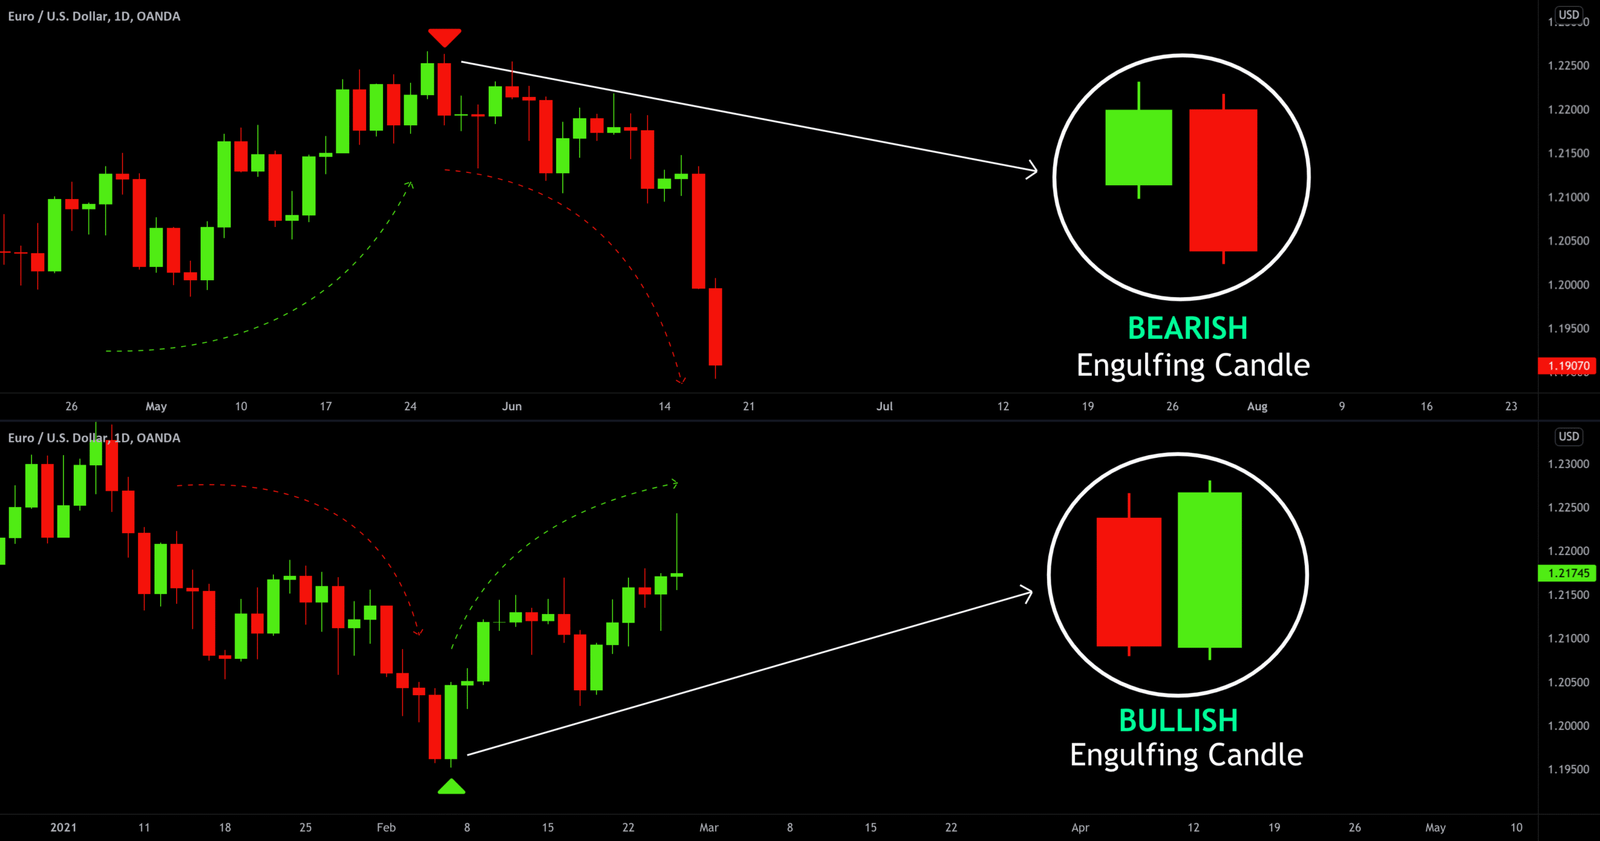
A bullish engulfing pattern is made up of two candles. The second candle completely overlaps, or “engulfs,” the body of the first one. As I mentioned earlier, an engulfing candle is a sign of a possible reversal. In this case, a bullish engulfing candle suggests that the market, which was in a bearish (downward) trend, might flip and turn bullish (upward). You’ll usually see this pattern show up at the end of a downtrend.
Bearish Engulfing Candle
A bearish engulfing pattern also has two candles, with the second one covering or hiding the first. But this time, it’s the opposite of the bullish engulfing candle. It often appears at the end of an uptrend and signals that the current bullish move could run out of steam and switch to bearish. Basically, it’s the market’s way of saying, “hey, things might be going downhill from here!
Bullish Engulfing Pattern vs. Bearish Engulfing Pattern
Here’s a quick comparison of the bullish and bearish engulfing patterns at a glance.
| Feature | Bullish Engulfing | Bearish Engulfing |
|---|---|---|
| Pattern Type | Reversal (bullish) | Reversal (bearish) |
| Market Context | Appears in a downtrend or at support zones | Appears in an uptrend or at resistance zones |
| Candle Structure | A small red (bearish) candle followed by a large green (bullish) candle | A small green (bullish) candle followed by a large red (bearish) candle |
| Engulfing Criteria | The green candle’s body fully covers the prior red candle’s body | The red candle’s body fully covers the prior green candle’s body |
How to Trade with an Engulfing Candle Pattern
By now, you should have a clear idea of what an engulfing pattern means and what each type signals. But here’s the thing: in technical analysis, nothing really clicks until you actually open a chart and practice spotting these patterns yourself. Learning the definition is just the first step. Real progress comes when you see them play out on real charts. To make it easier, here’s a step-by-step guide to trading with this candle:
1- Find the Key Support or Resistance Levels
For a bullish engulfing pattern, look for a downtrend and key support zones and areas where buying pressure is strong enough to push the price upward.
For a bearish engulfing pattern, find resistance levels where selling pressure takes over and pushes the price downward.
2- Identify Bullish or Bearish Engulfing Pattern
In a bullish engulfing, the second candle is bullish and completely covers the body of the first candle. In a bearish engulfing, the second candle is bearish and fully covers the first one.
Once you see these two candles in a row, you’ve got an engulfing pattern.
3- Confirm the Engulfing Pattern (Using Technical Indicators or Chart Patterns)
It’s always better to wait for confirmation. For example, if you spot a bullish engulfing, you can confirm it with other reversal price chart patterns like the Head and Shoulders or double top and bottom patterns, indicators like the RSI, MACD, or even other candlestick patterns such as the Tweezer top and bottom, Hammer, and Shooting Star. This gives you more confidence that the move is real and not a fake-out.
4- Identify Entry Points
After recognizing a bullish or bearish engulfing candle, you can plan your entry point. Some traders enter a short or long position right after the second candle forms, while others wait for extra confirmation. Your choice depends on your trading style and risk tolerance. And don’t forget: plan your exit point along your entry.
5- Adjust Stop-Loss and Take-Profit Orders
Managing risk is just as important as spotting the pattern:
- For a bullish engulfing, place your stop-loss order just below the low of the engulfing candle.
- For a bearish engulfing, place your stop-loss order just above the high of the engulfing candle.
- Take-profit orders can be set near strong support/resistance zones, moving averages, or Fibonacci levels. This way, you lock in profits without getting too greedy (because let’s be real, the market doesn’t care about your hopes).
To really see how an engulfing strategy works, I’ll walk you through a practical example in the next sections. So don’t miss the real scenarios below.
Bullish Engulfing Candle Pattern Real Example
As you can see in the chart below, the trend was moving downward until the price reached a key support level. At this point, selling pressure started to fade, buyers stepped in, and a strong bullish engulfing candle formed at the bottom of the downtrend. This candle completely engulfed the previous one, signaling a potential reversal.
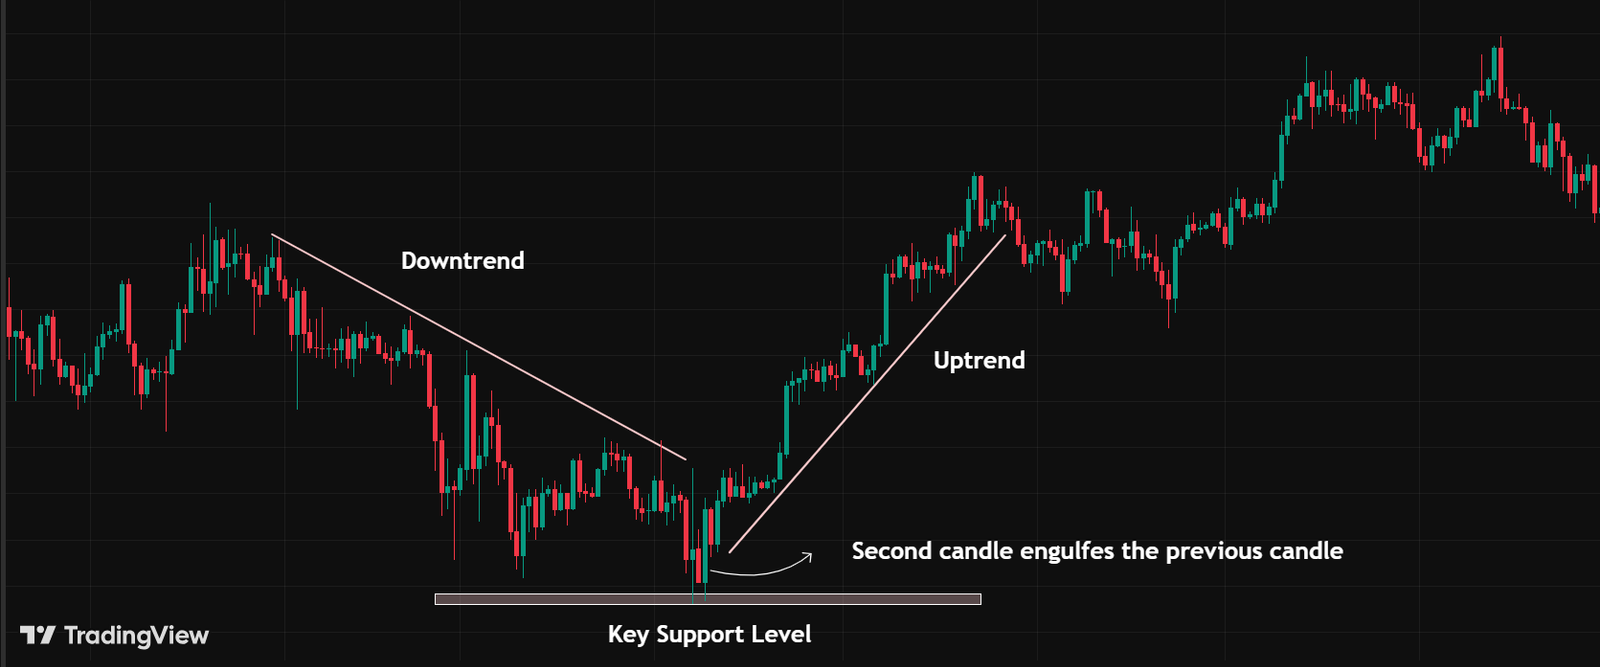
In this scenario, if you wanted to enter a long position, your setup could look like this:
- Place your entry point right after the bullish engulfing candle closes.
- Set your stop-loss just below the low of the engulfing candle.
- Put your take-profit near the previous resistance zone or recent swing highs.
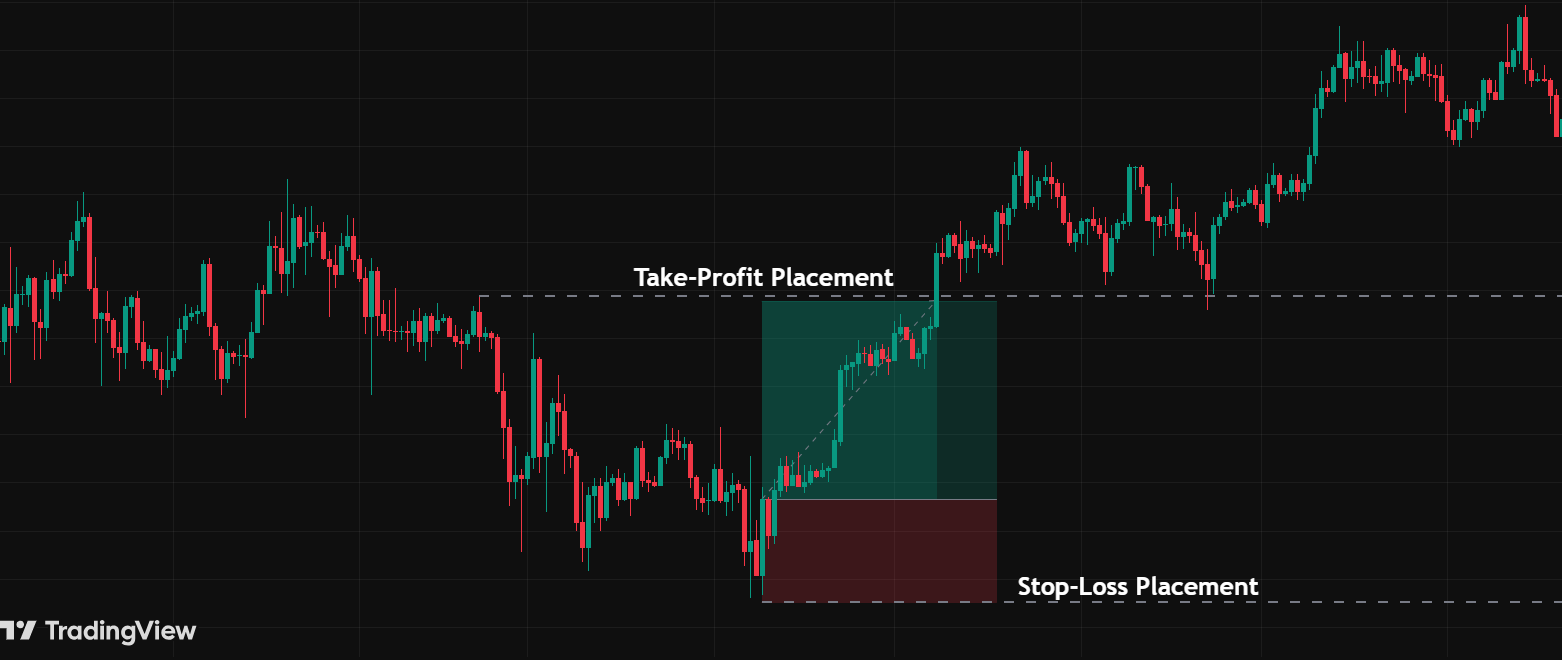
This way, you’re trading with the trend reversal in mind while keeping risk under control. Simple, right? No need to overcomplicate it.
Bearish Engulfing Candle Pattern Real Example
In the last example, I showed you a real case where a bullish reversal started right after a bullish engulfing pattern. Now, let’s check out another real scenario, this time with a bearish engulfing candle.
In the image below, you’ll notice a reversal from bearish to bullish. At the bottom of the uptrend, a bearish engulfing pattern showed up, and right after that, the reversal took place.
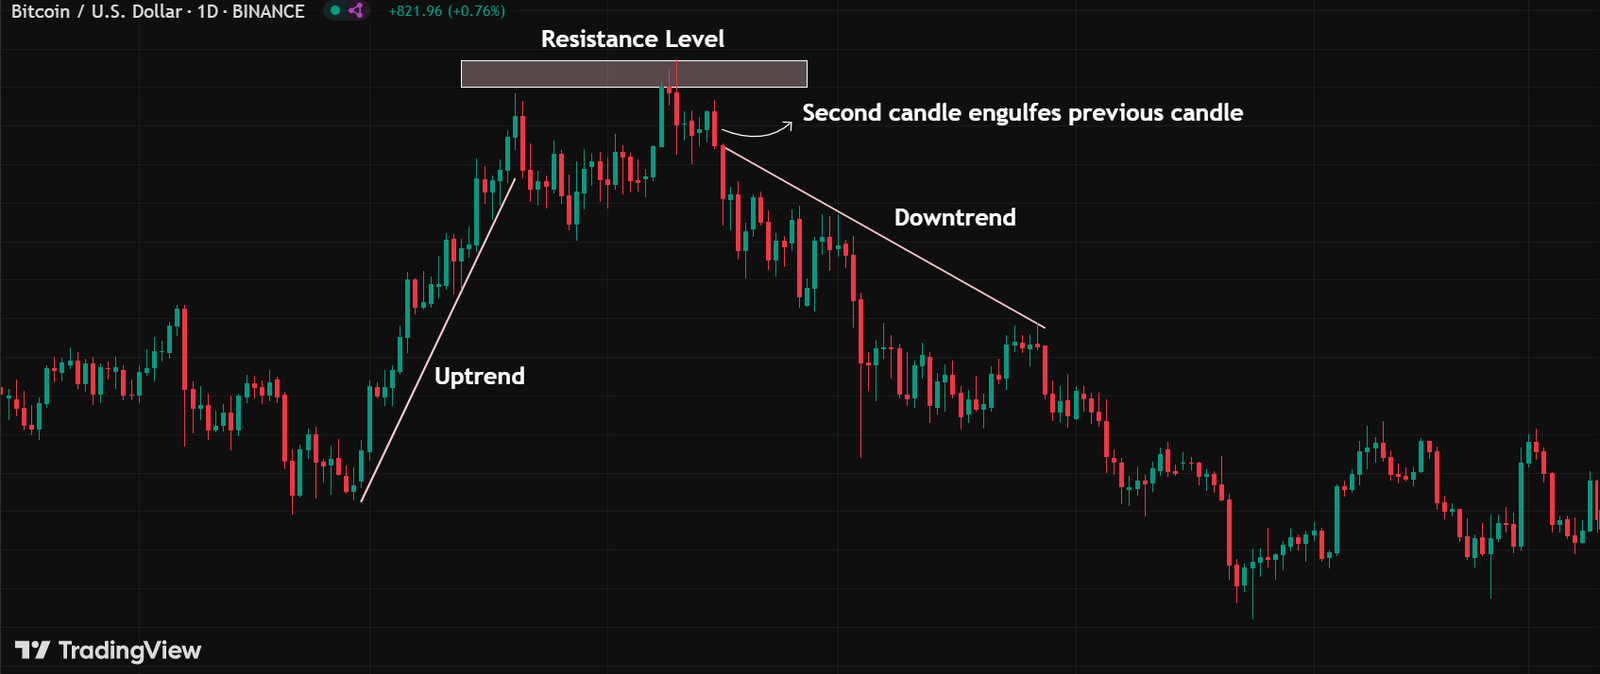
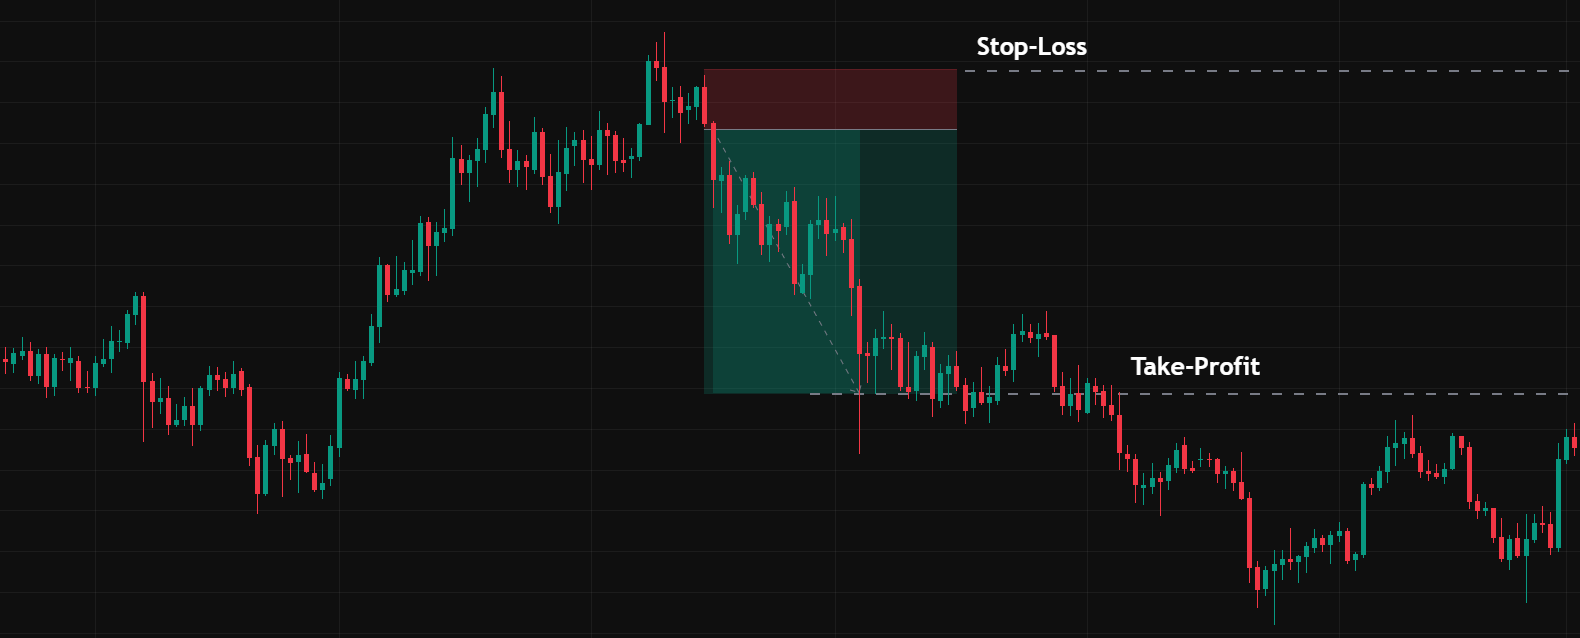
From this setup, you could enter a short position once the second candle closed. Here’s how you’d manage it:
- Place your stop-loss order just above the engulfing candle.
- Place your take-profit order below the previous support level or swing lows.
Engulfing Candle in Binary Options Trading
Using the engulfing candle works well for binary options traders, too. In this case, I combined it with another technical indicator, like the RSI, to make the setup even stronger. You can check out more about this tool in our article on the best indicators for binary options trading.
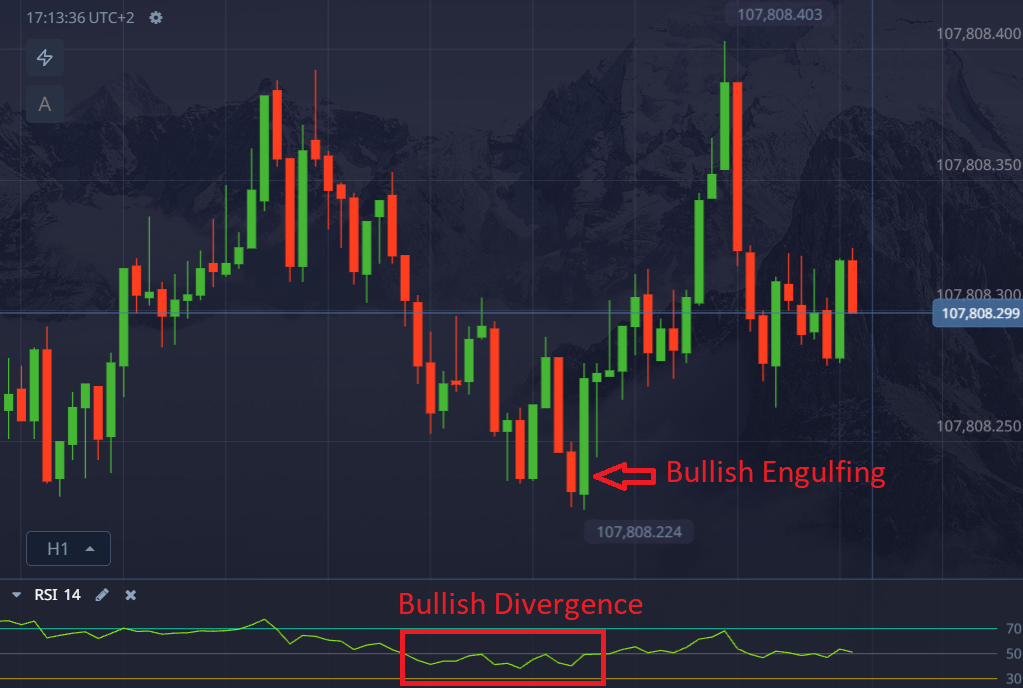
In the chart above, you’ll see a bullish engulfing pattern forming at the end of a downtrend. At the same time, the RSI shows a bullish divergence. That’s a solid sign the downtrend is about to reverse, confirming the bullish engulfing pattern.
Englufing Candle Pattern Pros and Cons
Candlestick patterns like Engulfing, Gravestone Doji, and Dragonfly can give us a good idea of where the market might head next. But of course, they’re not perfect, and engulfing patterns are no exception. Knowing both the pros and cons of engulfing candlestick patterns will help you fine-tune your strategy and aim for better results. After all, no single pattern is a magic trick.
Top Tips When Trading with the Engulfing Candle Pattern
By now, you already know what the engulfing candle pattern is and how it works. Next, let’s go over some handy pro tips for trading with this pattern (and a few others, too).
Identify Market Context First
A bullish engulfing candle usually shows up at the end of a downtrend, while a bearish engulfing candle shows up at the end of an uptrend. That’s why you should always start by checking the overall market trend before looking for these patterns.
Use Higher Timeframes
Sometimes, relying only on engulfing candle patterns is not enough, and you may need to wait for more confirmation. As I’ve already mentioned earlier, one option is to use technical indicators such as DMI, Vortex, ADX, and others.
Another option is to spot engulfing candles on higher timeframes, since they are more valid there. In short timeframes or in sideways/range markets, they don’t work as well.
Follow Risk Management Tips
Always protect your capital first. Use stop-loss and take-profit orders, and never risk more than 1–2% of your account on a single trade. Profits come later; survival in the market comes first.
Backtest your Strategy
Last but not least, always remember to backtest your strategy and improve it over time. This will help you see what works best and what doesn’t.
Conclusion
That’s a wrap on engulfing candle patterns, along with some real examples of how they play out. Make sure to try them in live trading only after you’ve built a clear and well-optimized strategy, and don’t forget the tips we’ve shared in this article.
If you’d like to learn more, check out our other articles on the Crypoption Hub blog, where we dive into different patterns and technical tools to help you level up your trading game. Trust me, it’s worth a look.
FAQ
What is an engulfing pattern?
An engulfing candle pattern consists of two candles in a row, where the second one engulfs and covers the body of the first candle.
Is the engulfing strategy good?
A trading strategy based on the engulfing pattern can be effective; however, it’s better to combine it with other technical tools, such as reversal indicators.
How do you confirm an engulfing candle?
To confirm an engulfing candle, you can use reversal technical indicators such as RSI or MACD.


